Fig. 1
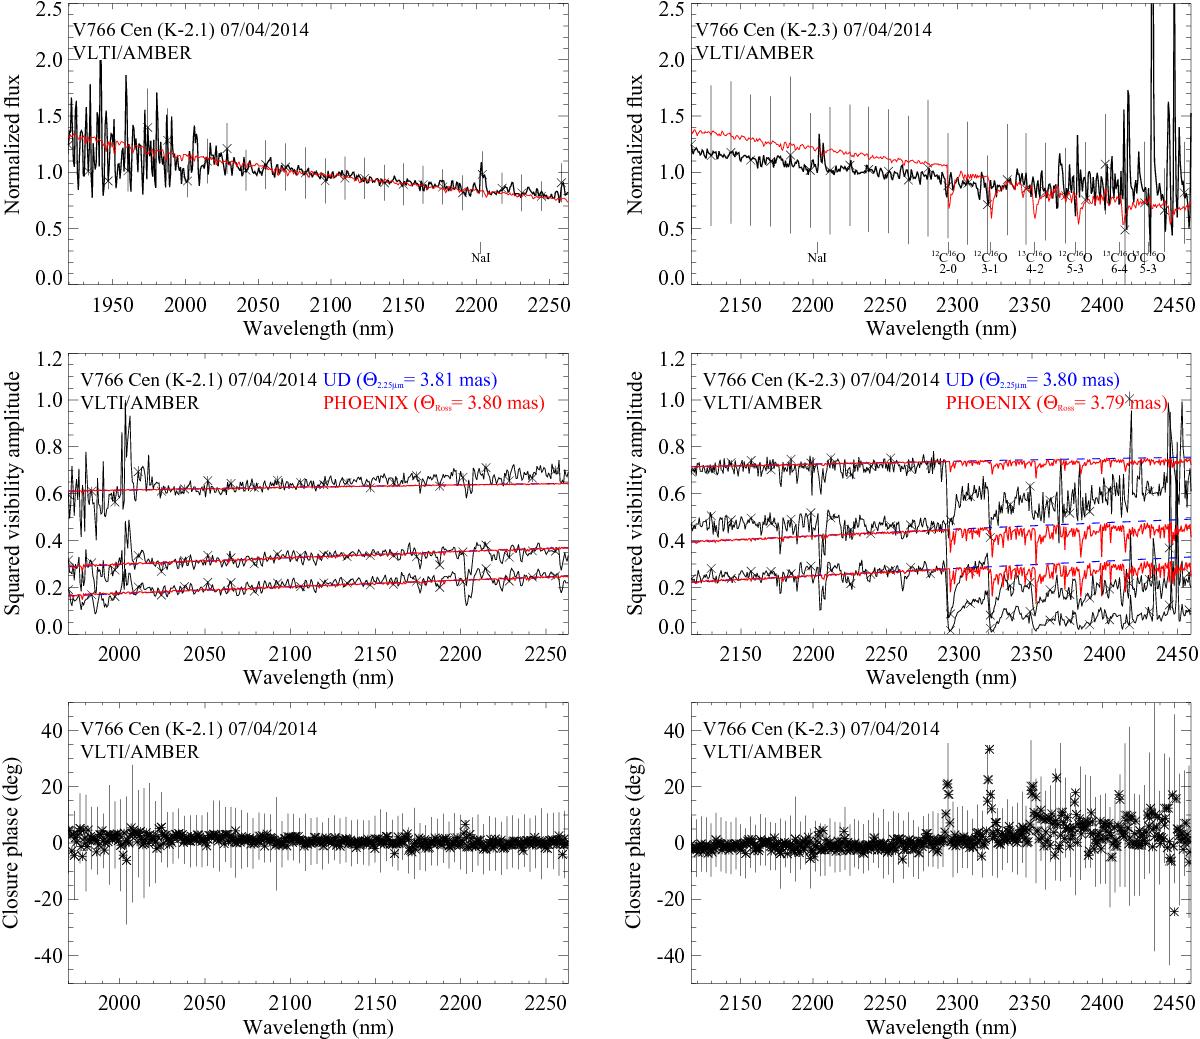
Left (from top to bottom): observed (black) normalized flux, squared visibility amplitudes, and closure phases of V766 Cen obtained with the MR-K 2.1 μm setting on 2014 April 07. Right: same as left but obtained with the MR-K 2.3 μm setting on 2014 April 07. The black solid lines connect all the observed data points, while for the sake of clarity, the “X” symbols and associated error bars are shown for only every fifth data point. The blue curves show the best-fit UD model, and the red curves the best-fit PHOENIX model prediction. The visibility plots (middle panels) show three curves, one for each of the three baselines of the AMBER triangle. (cf. Sect. 3.2).
Current usage metrics show cumulative count of Article Views (full-text article views including HTML views, PDF and ePub downloads, according to the available data) and Abstracts Views on Vision4Press platform.
Data correspond to usage on the plateform after 2015. The current usage metrics is available 48-96 hours after online publication and is updated daily on week days.
Initial download of the metrics may take a while.