Fig. 2
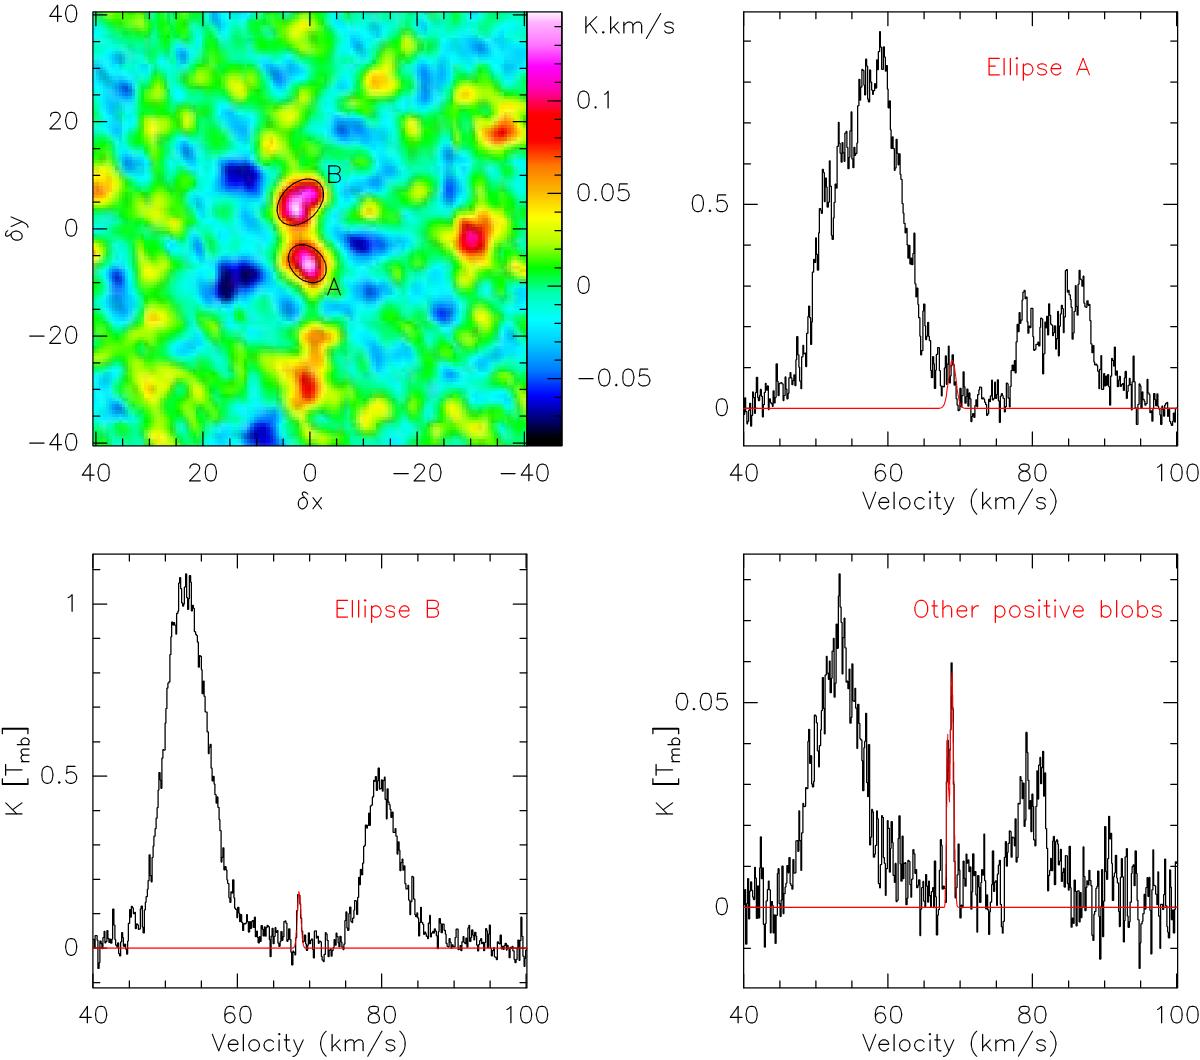
Results from the NOEMA observations for the NH2D transition at 86 GHz. Top left: line intensity integrated between 68.1 and 69.0 km s-1. Top right: spectra integrated over ellipse A. Bottom left: spectra integrated over ellipse B. Bottom right: spectra integrated over all pixels of the top left image whose integrated intensity belongs to the [0.025, 0.2 K km s-1] range, except pixels inside ellipse A and B.
Current usage metrics show cumulative count of Article Views (full-text article views including HTML views, PDF and ePub downloads, according to the available data) and Abstracts Views on Vision4Press platform.
Data correspond to usage on the plateform after 2015. The current usage metrics is available 48-96 hours after online publication and is updated daily on week days.
Initial download of the metrics may take a while.