Fig. 9
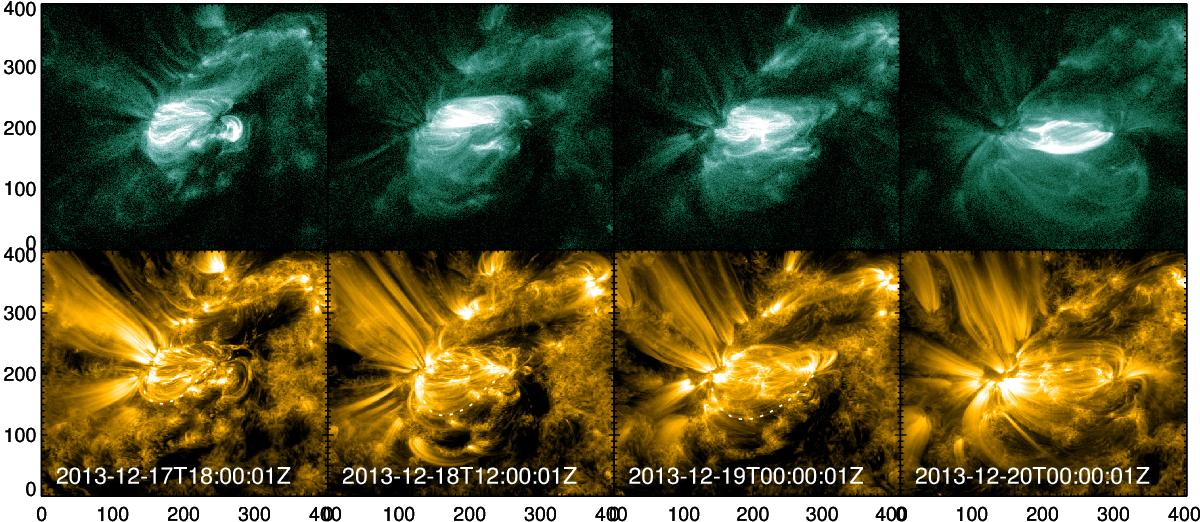
AIA coronal observations of AR 11928 in 94 Å (top row) and 171 Å (bottom row) wavelengths. Plasma loops represent the magnetic structure in the AR connecting the magnetic regions at the photosphere. A prominent loop and its shape transformation is shown with a dotted white line. The field of view is same as Fig. 2 with axis units in arc seconds and origin set at the left bottom corner.
Current usage metrics show cumulative count of Article Views (full-text article views including HTML views, PDF and ePub downloads, according to the available data) and Abstracts Views on Vision4Press platform.
Data correspond to usage on the plateform after 2015. The current usage metrics is available 48-96 hours after online publication and is updated daily on week days.
Initial download of the metrics may take a while.