Fig. 7
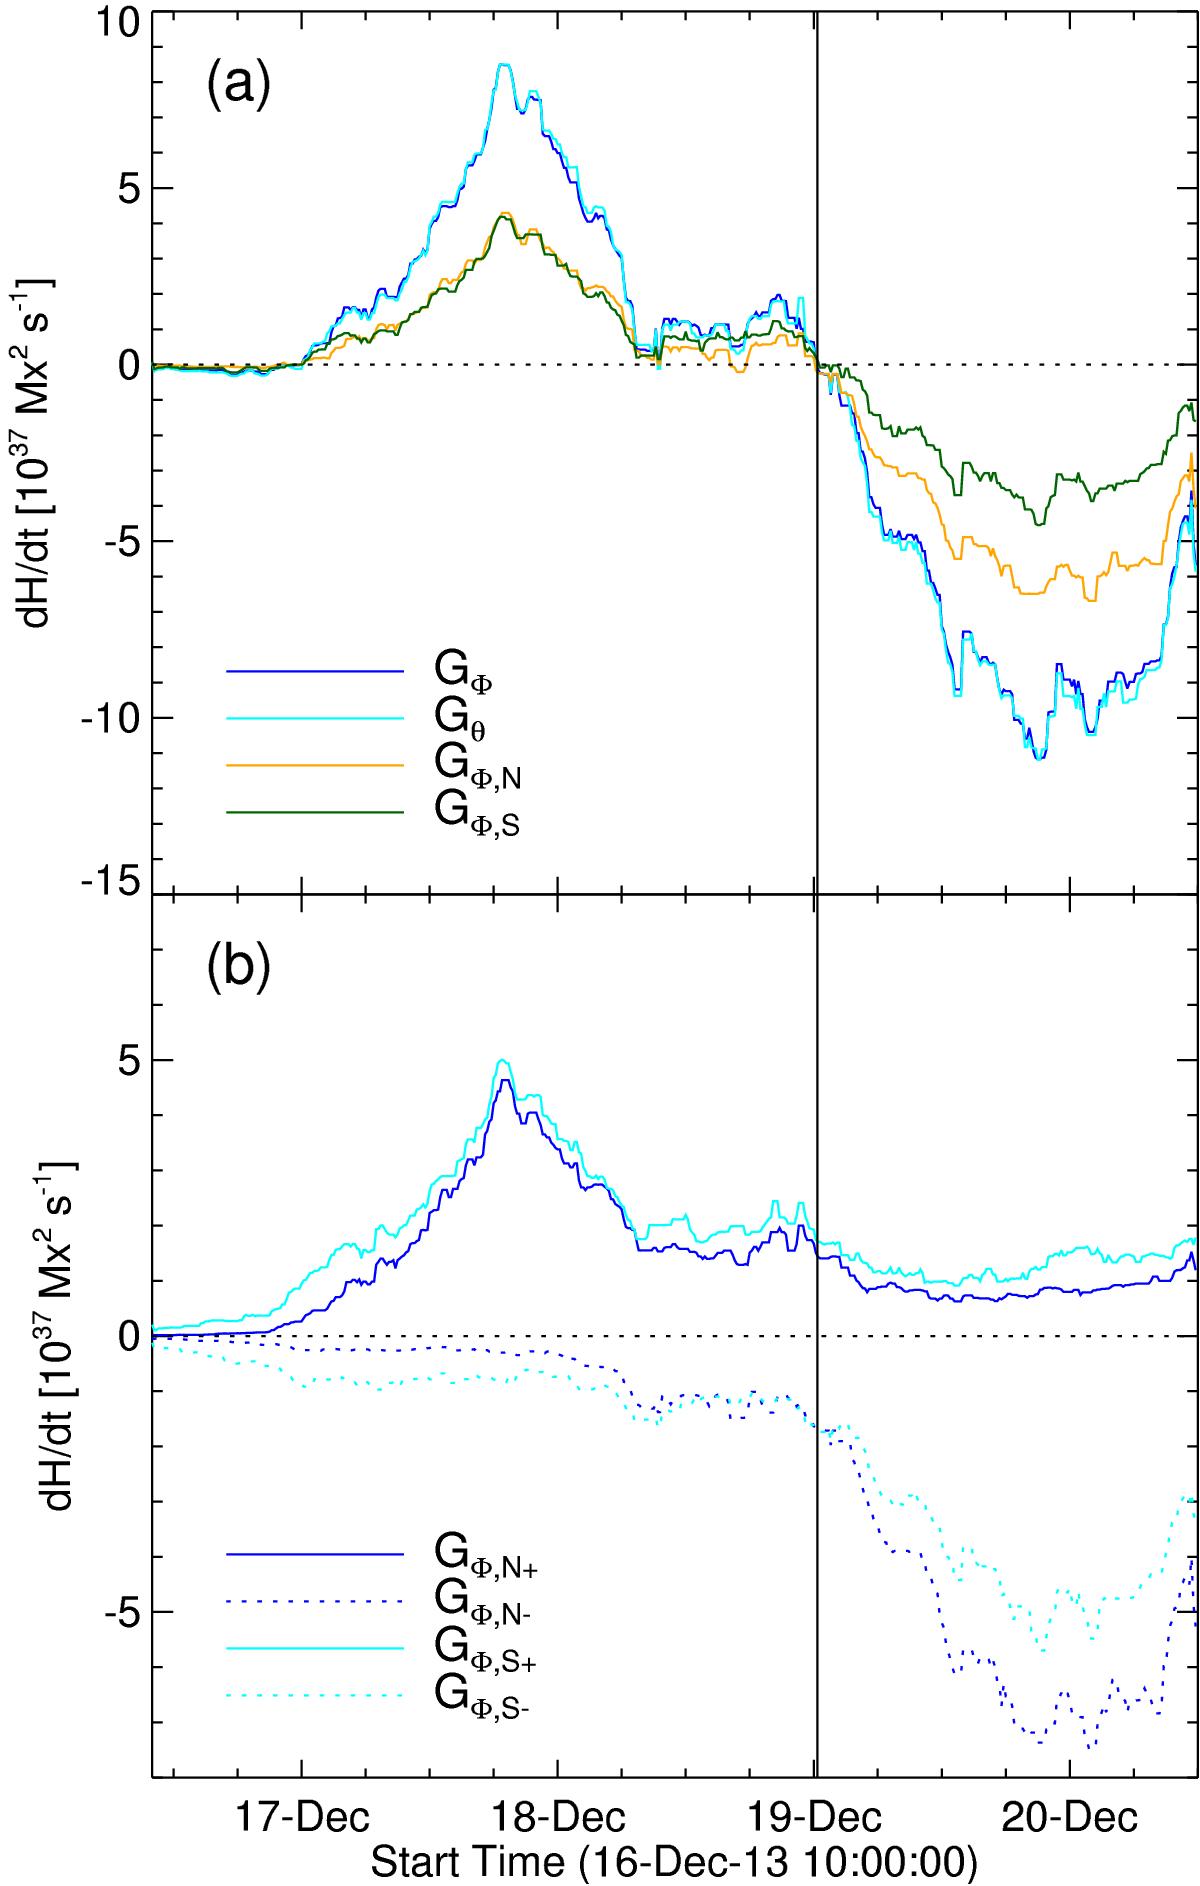
a) Time evolution of the net helicity flux in AR 11928, which turns from positive to negative at 20T00:20 UT (black vertical line). Earlier on the net magnetic helicity flux computed with GΦ have well-correlated profiles in both north (orange) and south (green) polarities. This indicates a proper redistribution at footpoints of closed field lines (reaching the computation box boundary). Later on, after 18:00 UT December 18, unequal net values in north and south polarities are present owing to undefined connectivity for open field lines. b) Evolution of the signed net helicity flux in positive and negative magnetic polarities.
Current usage metrics show cumulative count of Article Views (full-text article views including HTML views, PDF and ePub downloads, according to the available data) and Abstracts Views on Vision4Press platform.
Data correspond to usage on the plateform after 2015. The current usage metrics is available 48-96 hours after online publication and is updated daily on week days.
Initial download of the metrics may take a while.