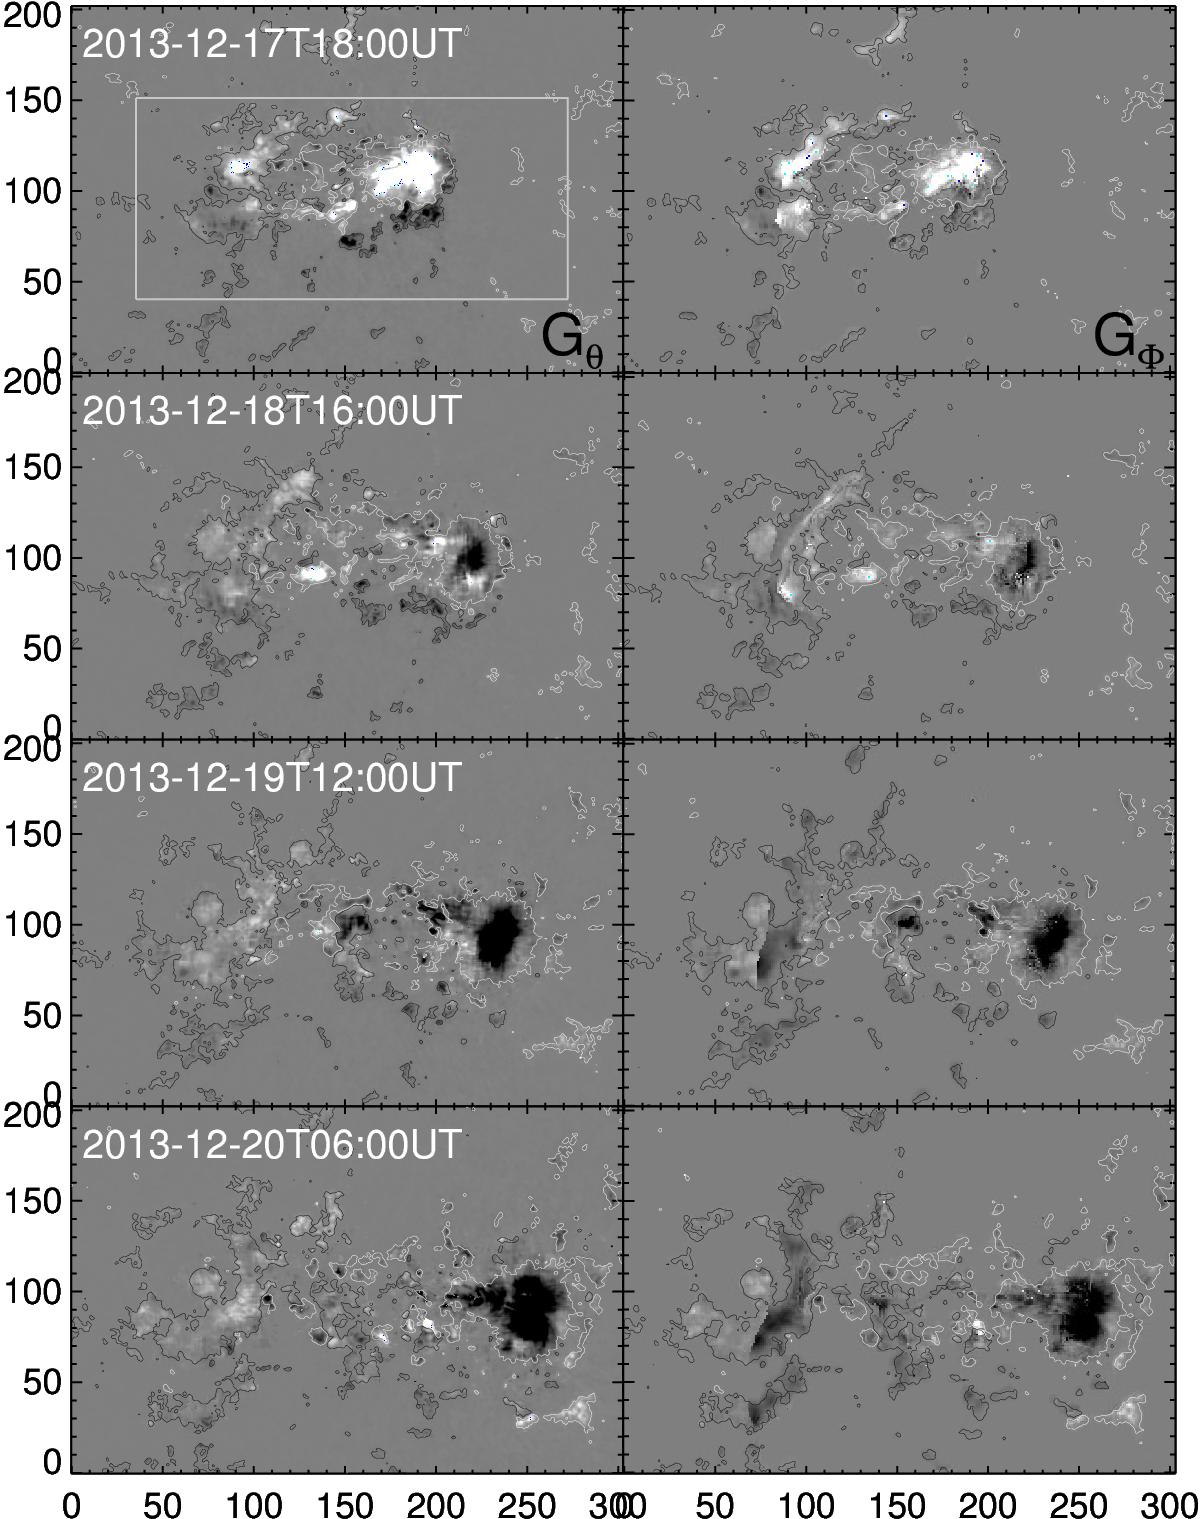
Fig. 6

Snapshots of helicity flux distributions with Gθ maps (left column) and GΦ maps (right column) at four different times of the evolution of AR 11928. GΦ is derived from Gθ taking into account the connectivity of the field line footpoints (Eq. (6)). Intense positive helicity flux in Gθ maps is associated with the leading major sunspot polarity, which becomes negative over the time. This flux is redistributed to the following polarity flux by closed field lines in GΦ maps. In all panels, contours of Bz at ± 120 G (black/white) are overplotted. All maps were scaled with gray levels within ± 1 × 10-19 Mx2 cm-2 s-1. Axes units are in arcseconds and the field of view is same as indicated by the black dashed rectangle in Fig. 2a. The rectangular white box in the top left panel refers to the field of view of the panels in Fig. 1.
Current usage metrics show cumulative count of Article Views (full-text article views including HTML views, PDF and ePub downloads, according to the available data) and Abstracts Views on Vision4Press platform.
Data correspond to usage on the plateform after 2015. The current usage metrics is available 48-96 hours after online publication and is updated daily on week days.
Initial download of the metrics may take a while.


