Fig. 5
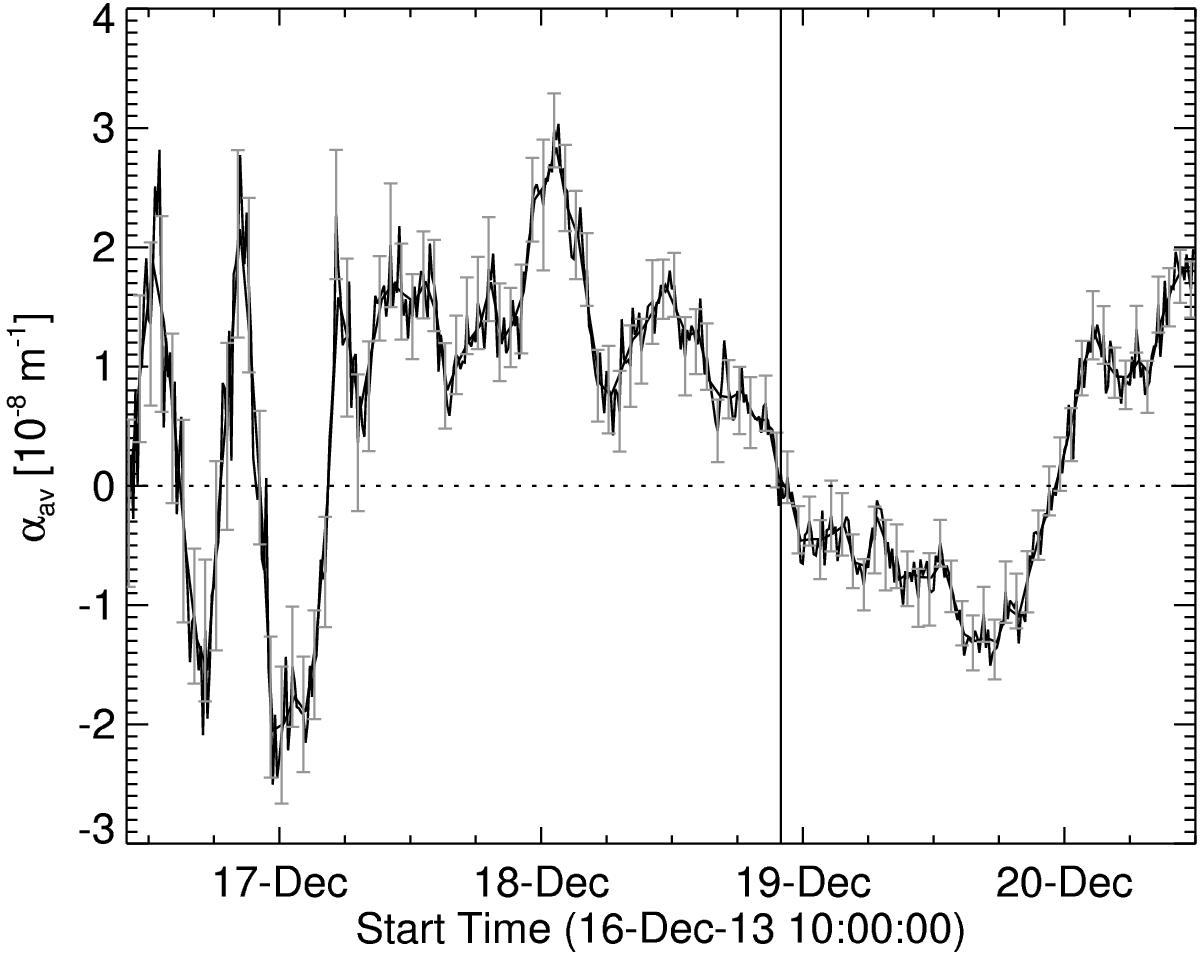
Time evolution of αav (defined by Eq. (7)) in the entire AR 11928. The error bars are obtained from a least squares regression procedure in the plot of Jz and Bz (see Eq. (8)). The value αav changes sign several times at the beginning of the emergence, as well as later on when the AR is well developed at 18T22:00 UT (vertical line).
Current usage metrics show cumulative count of Article Views (full-text article views including HTML views, PDF and ePub downloads, according to the available data) and Abstracts Views on Vision4Press platform.
Data correspond to usage on the plateform after 2015. The current usage metrics is available 48-96 hours after online publication and is updated daily on week days.
Initial download of the metrics may take a while.