Fig. 2
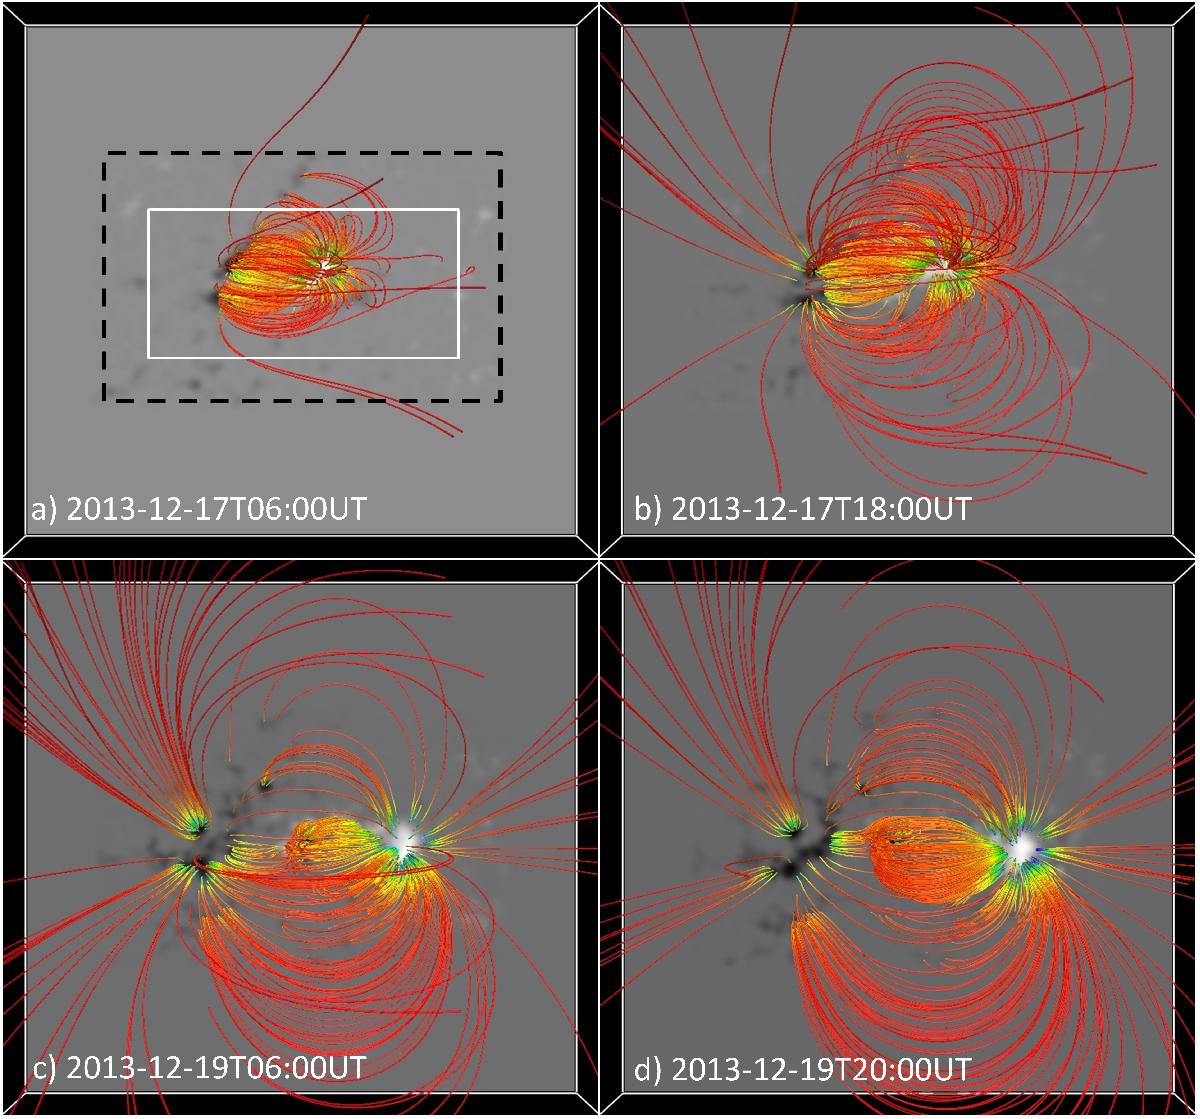
Top view of the magnetic structure of AR 11928 at four different times of the evolution. Color scale along each field line represents the horizontal field strength. The lower boundary (z = 0) shows the vertical component Bz at the photospheric level with gray levels in the range [−100, 100] G. The white rectangular box in panel a) refers to the field of view of panels in Fig. 1 and the black dashed rectangular box indicates the field of view of observations as plotted in Fig. 6.
Current usage metrics show cumulative count of Article Views (full-text article views including HTML views, PDF and ePub downloads, according to the available data) and Abstracts Views on Vision4Press platform.
Data correspond to usage on the plateform after 2015. The current usage metrics is available 48-96 hours after online publication and is updated daily on week days.
Initial download of the metrics may take a while.