Fig. 8
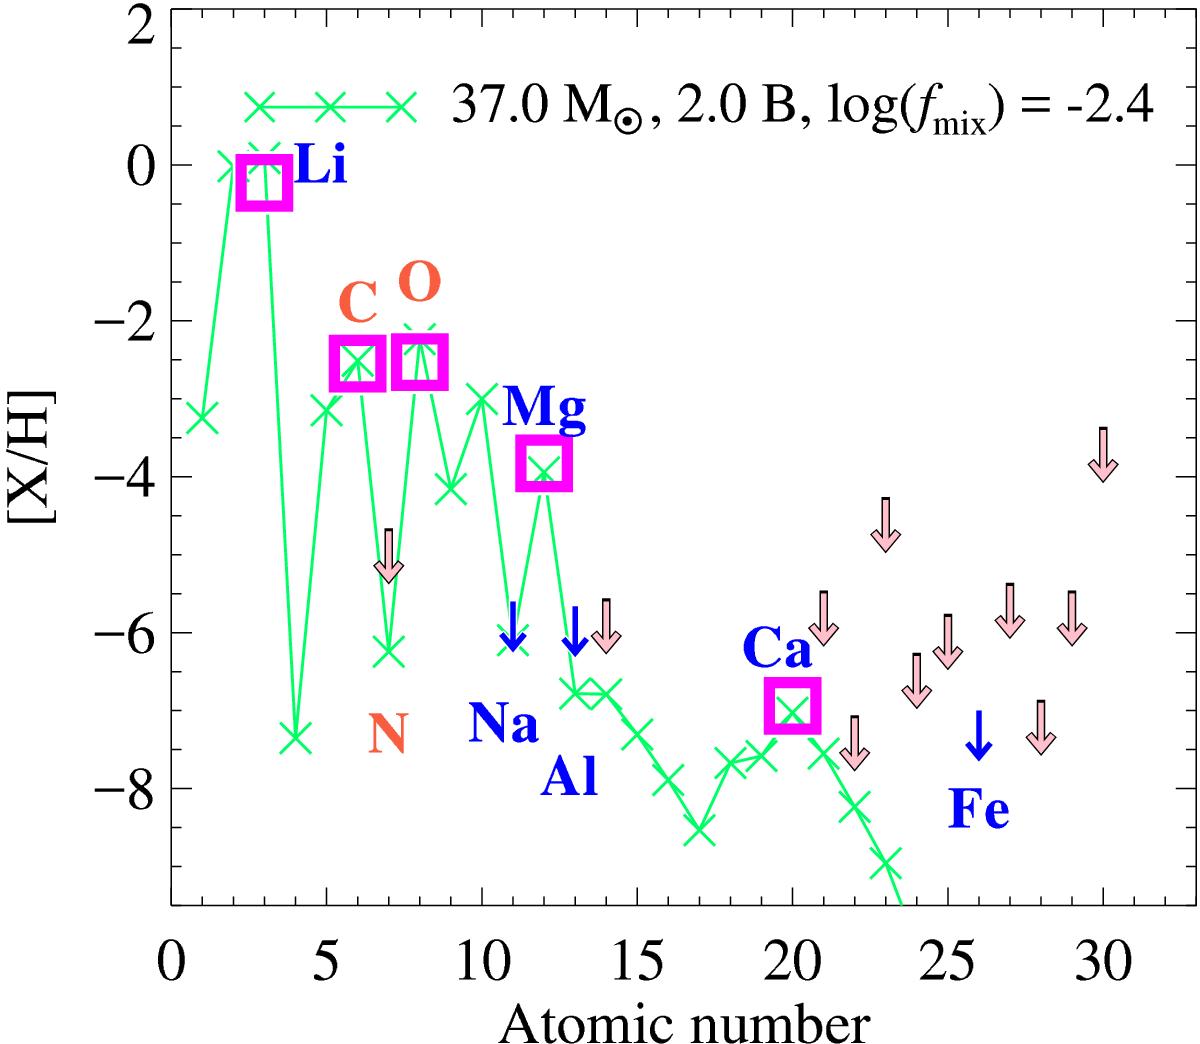
Best fitting core-collapse supernova model yields (Heger & Woosley Heger & Woosley 2010) mixed with primordial BBN-composition gas (see text), compared to the inferred abundances and upper limits listed in Table 4. Labeled elements are based on 3D NLTE analysis of atomic lines (blue characters, this work) or 3D LTE analysis of molecular lines (orange characters, from Bessell et al. 2015). Other upper limits are based on 1D LTE analyses (from Bessell et al. 2015). The progenitor stellar mass, explosion energy, and amount of mixing of the best-fit model are indicated in the legend.
Current usage metrics show cumulative count of Article Views (full-text article views including HTML views, PDF and ePub downloads, according to the available data) and Abstracts Views on Vision4Press platform.
Data correspond to usage on the plateform after 2015. The current usage metrics is available 48-96 hours after online publication and is updated daily on week days.
Initial download of the metrics may take a while.