Fig. 6
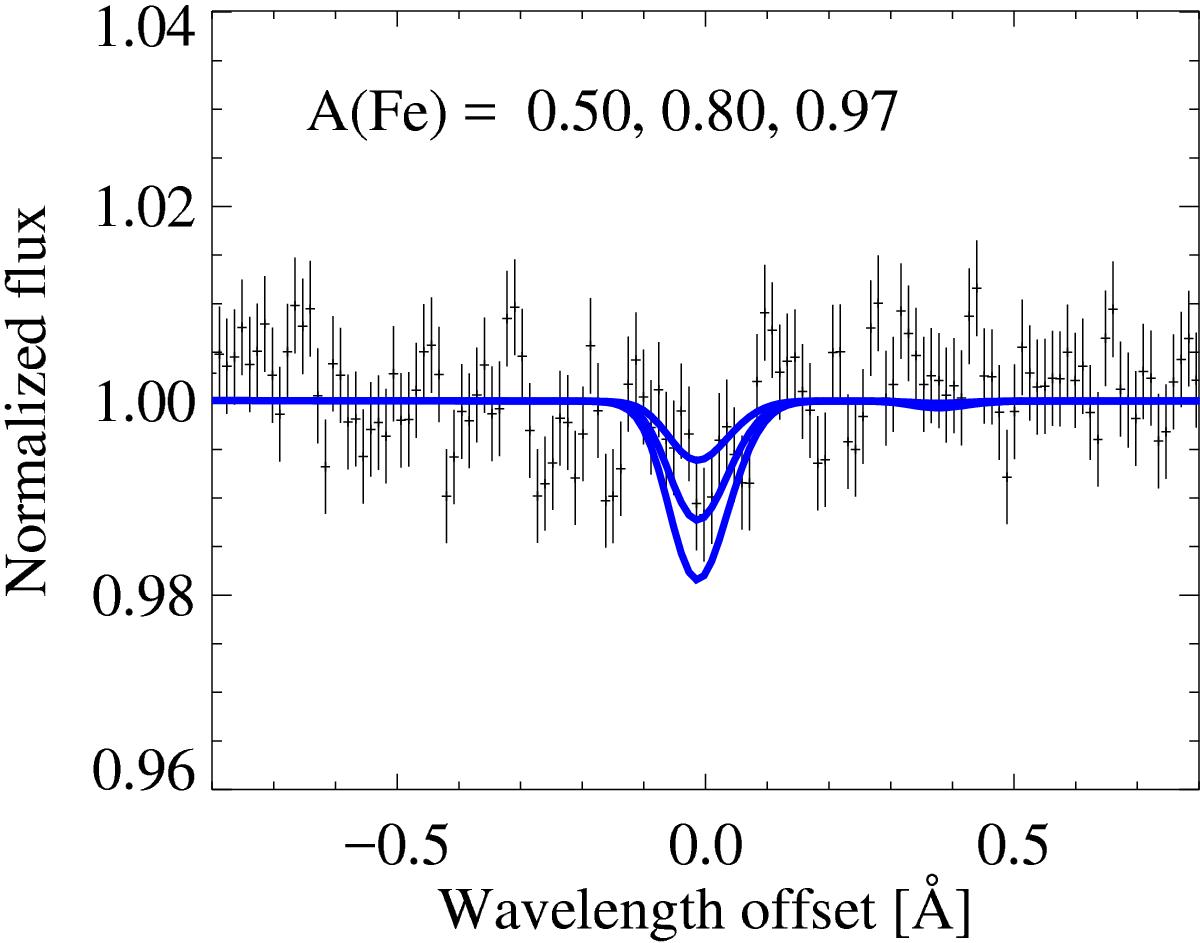
Upper limit determination for iron, comparing stacked spectra centered on the six strongest unblended lines, Fe i 3440.6, 3581.2, 3719.9, 3737.1, 3820.4 and 3859.9 Å. The 3D NLTE line profiles are shown for the 1σ, 2σ and 3σ upper limits, corresponding to line strengths of 0.7, 1.5 and 2.2 mÅ. The small bump at + 0.4 Å in the synthetic spectrum is due to the nearby line Fe i 3441.0 Å.
Current usage metrics show cumulative count of Article Views (full-text article views including HTML views, PDF and ePub downloads, according to the available data) and Abstracts Views on Vision4Press platform.
Data correspond to usage on the plateform after 2015. The current usage metrics is available 48-96 hours after online publication and is updated daily on week days.
Initial download of the metrics may take a while.