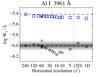
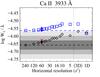
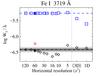
Fig. 5
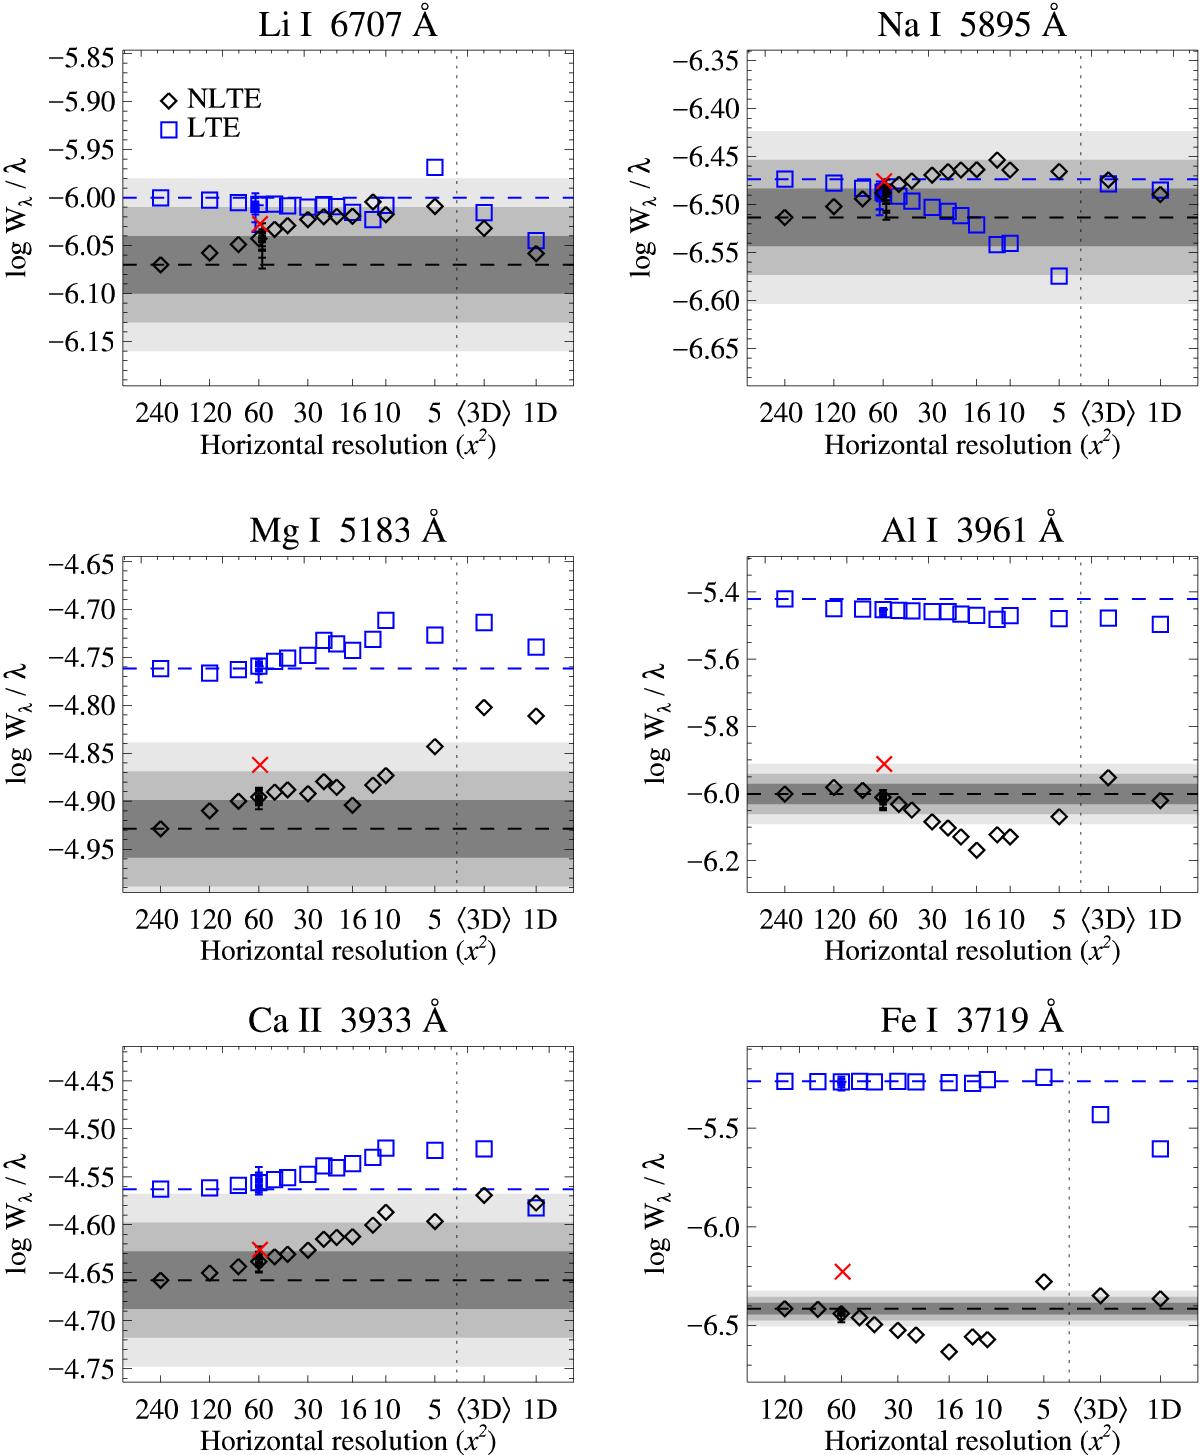
Variation of predicted disk-integrated line strengths, as inferred from a snapshot from the hydrodynamical simulation downsampled from the original 2402 grid points as well as the horizontally averaged ⟨ 3D ⟩ and hydrostatic 1D case. A vertical dashed line separates the 3D results from the 1D hydrostatic and ⟨ 3D ⟩ results. Calculations in NLTE (black diamonds) and LTE (blue squares) are illustrated for representative lines using A(Li) = 0.70, A(Na) = 0.89, A(Mg) = 3.80, A(Al) = 1.15, A(Ca) = −0.62, and A(Fe) = 0.60. When additional snapshots have been computed (at resolution 602), their individual results are indicated by horizontal lines. A red greek cross indicates the corresponding NLTE result computed in the so-called 1.5D approximation (at resolution 602). Each panel spans over 0.35 dex, except for Al and Fe due to their very strong NLTE effects. For clarity, the line strength determined from the highest-resolution model is indicated as a horizontal dashed line across each panel, and representative errors of 0.03, 0.06 and 0.09 dex are indicated by gray shaded regions.
Current usage metrics show cumulative count of Article Views (full-text article views including HTML views, PDF and ePub downloads, according to the available data) and Abstracts Views on Vision4Press platform.
Data correspond to usage on the plateform after 2015. The current usage metrics is available 48-96 hours after online publication and is updated daily on week days.
Initial download of the metrics may take a while.