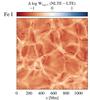
Fig. 3
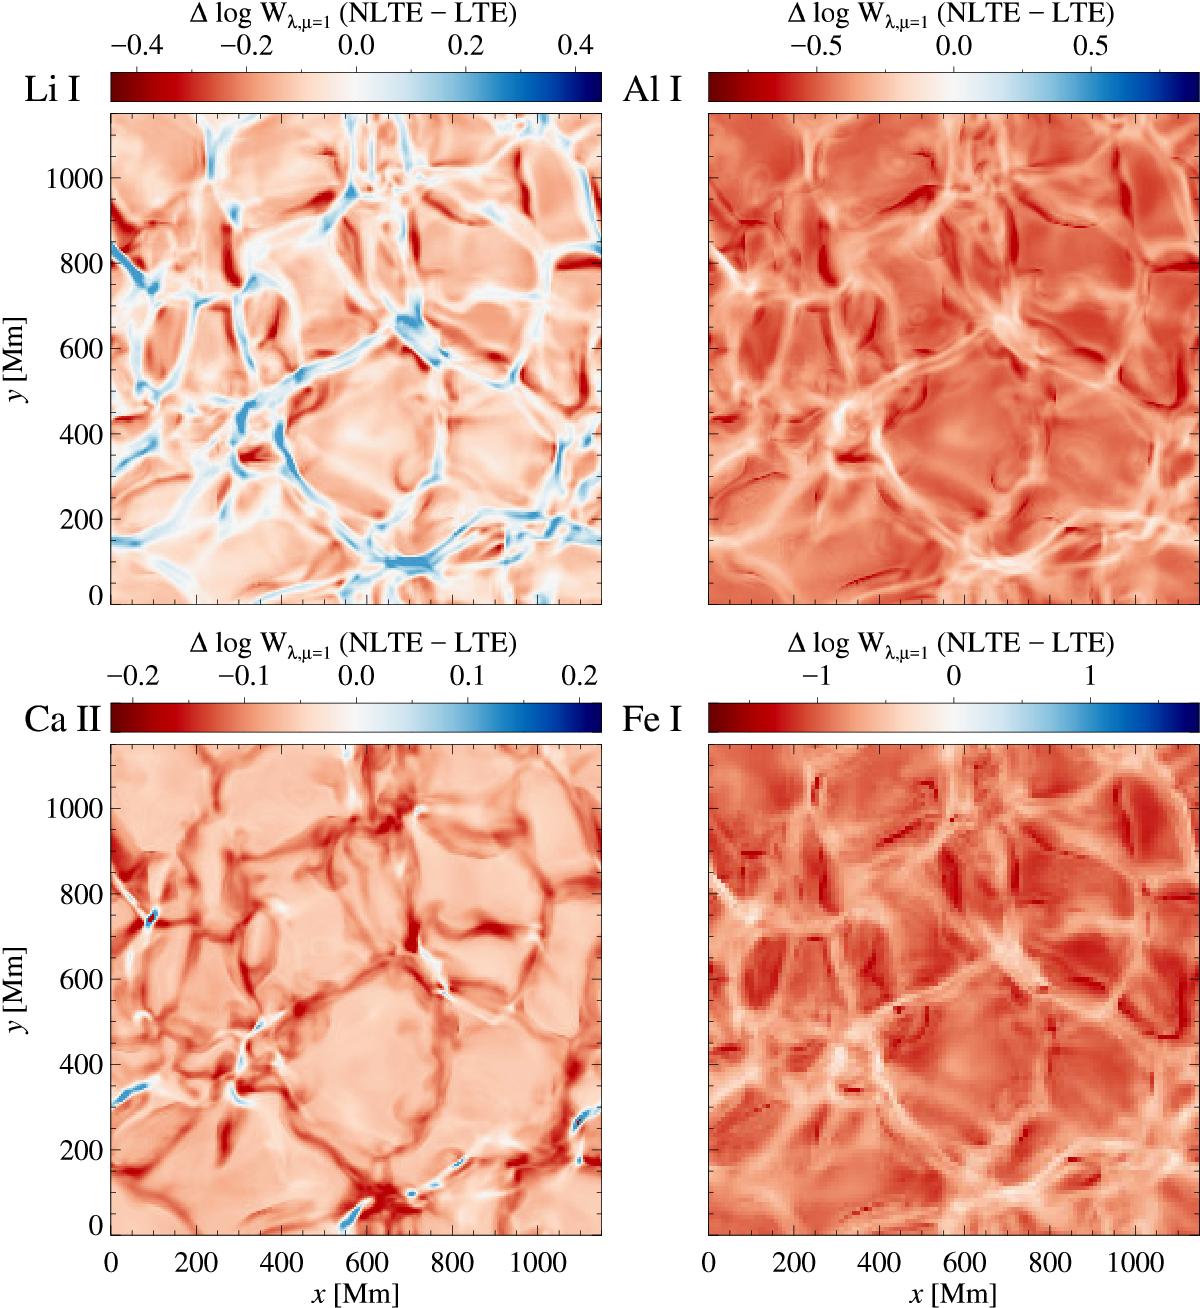
Spatially resolved NLTE equivalent width correction at disk-center intensity (μ = 1), shown for representative lines of Li i (6707 Å, top left), Al i (3961 Å, top right), Ca ii (3933 Å, bottom left), and Fe i (3719 Å, bottom right) in a high-resolution snapshot of the hydrodynamical model (2402 grid points for Li, Al and Ca; 1202 for Fe). Although the behavior is shown for vertical rays, we emphasize that the statistical equilibrium was solved using the 3D radiation field. The NLTE line strength correction, Δlog Wλ,μ = 1 = log Wλ,μ = 1(NLTE)−log Wλ,μ = 1(LTE), corresponds roughly to the abundance correction but with opposite sign. Red and blue colors indicate weaker and stronger lines under NLTE than under LTE, meaning positive and negative abundance corrections. For this illustration, we adopt the abundances A(Li) = 0.70, A(Al) = 1.15, A(Ca) = −0.62, and A(Fe) = 0.60. Na, not shown, behaves very similarly to Li, and the corresponding illustration for Mg is shown in the bottom left of Fig. 4.
Current usage metrics show cumulative count of Article Views (full-text article views including HTML views, PDF and ePub downloads, according to the available data) and Abstracts Views on Vision4Press platform.
Data correspond to usage on the plateform after 2015. The current usage metrics is available 48-96 hours after online publication and is updated daily on week days.
Initial download of the metrics may take a while.