Fig. 10
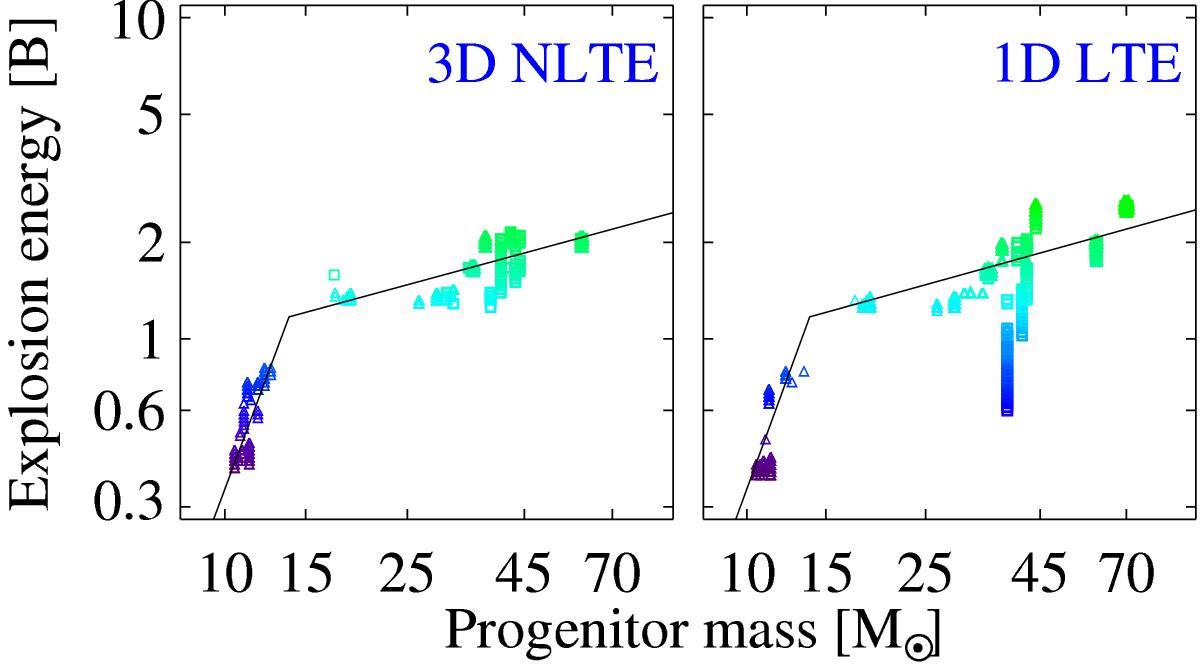
Comparison of progenitor mass and explosion energy among the well fitted (χ2< 3) supernova models. Colors (explosion energy) and symbols (mixing) carry the same meaning as in Fig. 9. Results are shown on the left for our recommended abundances (from Table 4) and on the right using 1D LTE abundances. To guide the eye, power-laws fitted to the low-mass and high-mass models in the left panel are shown also to the right.
Current usage metrics show cumulative count of Article Views (full-text article views including HTML views, PDF and ePub downloads, according to the available data) and Abstracts Views on Vision4Press platform.
Data correspond to usage on the plateform after 2015. The current usage metrics is available 48-96 hours after online publication and is updated daily on week days.
Initial download of the metrics may take a while.