Fig. 7
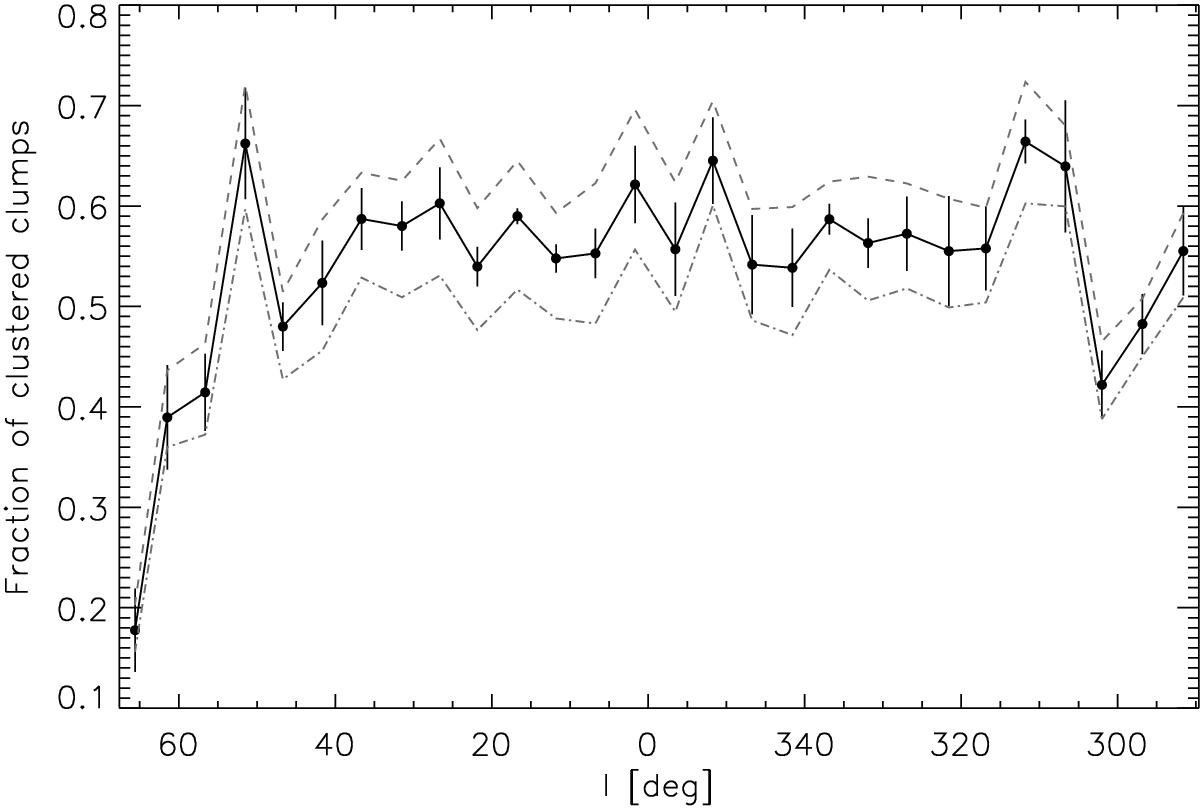
Spatial distribution of the fraction of clustered clumps as a function of Galactic longitude. The black line corresponds to the mean fraction of clustered clumps of each master catalogue (one for each window size) for each 5 deg bin. The black points correspond to this mean and are located at the average longitude of each bin. The 1σ error bars correspond to the standard deviation of the fraction of clustered clumps for each bin. The grey dashed and dot-dashed lines correspond to a value of ±5% of Λcut.
Current usage metrics show cumulative count of Article Views (full-text article views including HTML views, PDF and ePub downloads, according to the available data) and Abstracts Views on Vision4Press platform.
Data correspond to usage on the plateform after 2015. The current usage metrics is available 48-96 hours after online publication and is updated daily on week days.
Initial download of the metrics may take a while.