Fig. 6
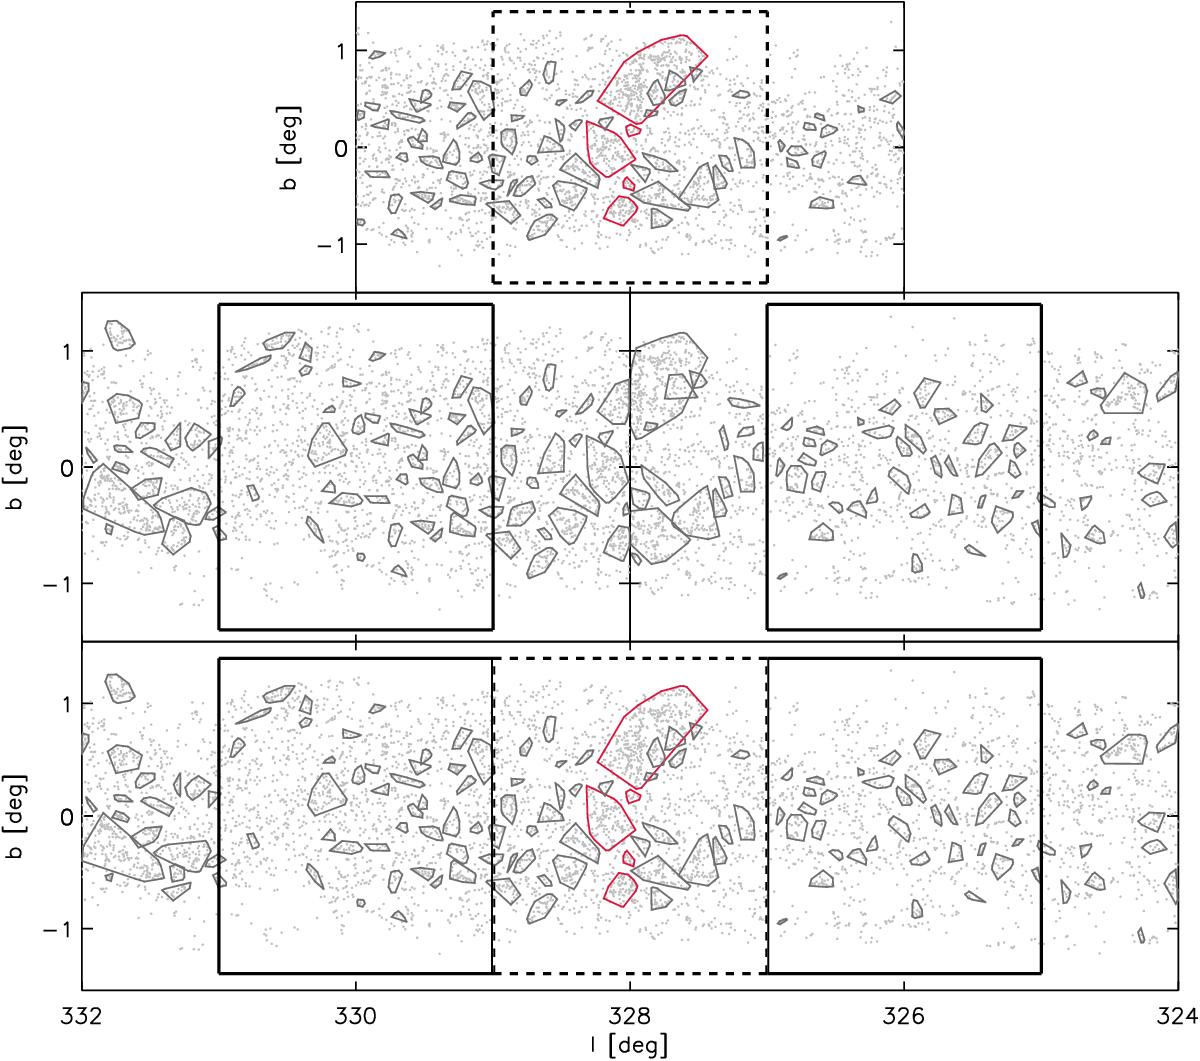
Example of the reconstructing of the over-density catalogue found by the MST method at the split between windows. This example field is 10 deg large. Grey points are the pre-stellar and proto-stellar clumps. The grey shapes correspond to the convex hulls of the over-densities with at least ten members. The red shapes are the convex hulls of the over-densities split over the two original windows. The black dashed and solid lines mark the separation limits for each window. The top window is the overlap window. The middle windows are the two original windows of this field. The bottom window is the result of the overlapping method.
Current usage metrics show cumulative count of Article Views (full-text article views including HTML views, PDF and ePub downloads, according to the available data) and Abstracts Views on Vision4Press platform.
Data correspond to usage on the plateform after 2015. The current usage metrics is available 48-96 hours after online publication and is updated daily on week days.
Initial download of the metrics may take a while.