Fig. 3
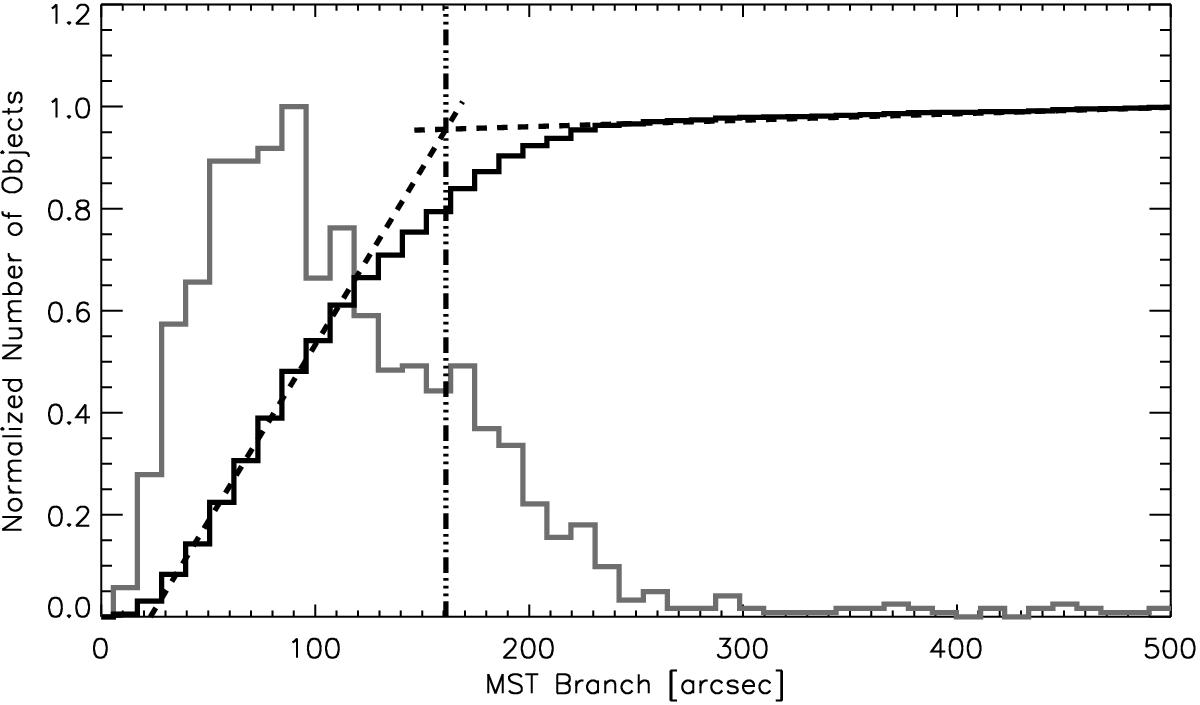
Distribution of the branch lengths found in the field displayed in Fig. 2. The grey line corresponds to the branch length histogram, whilst the black line is the cumulative distribution. The two dashed black lines are the fitted segments to the cumulative distribution. The dashed-dot line shows the cut-off branch length found at the intersection of these fits.
Current usage metrics show cumulative count of Article Views (full-text article views including HTML views, PDF and ePub downloads, according to the available data) and Abstracts Views on Vision4Press platform.
Data correspond to usage on the plateform after 2015. The current usage metrics is available 48-96 hours after online publication and is updated daily on week days.
Initial download of the metrics may take a while.