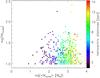
Fig. 17
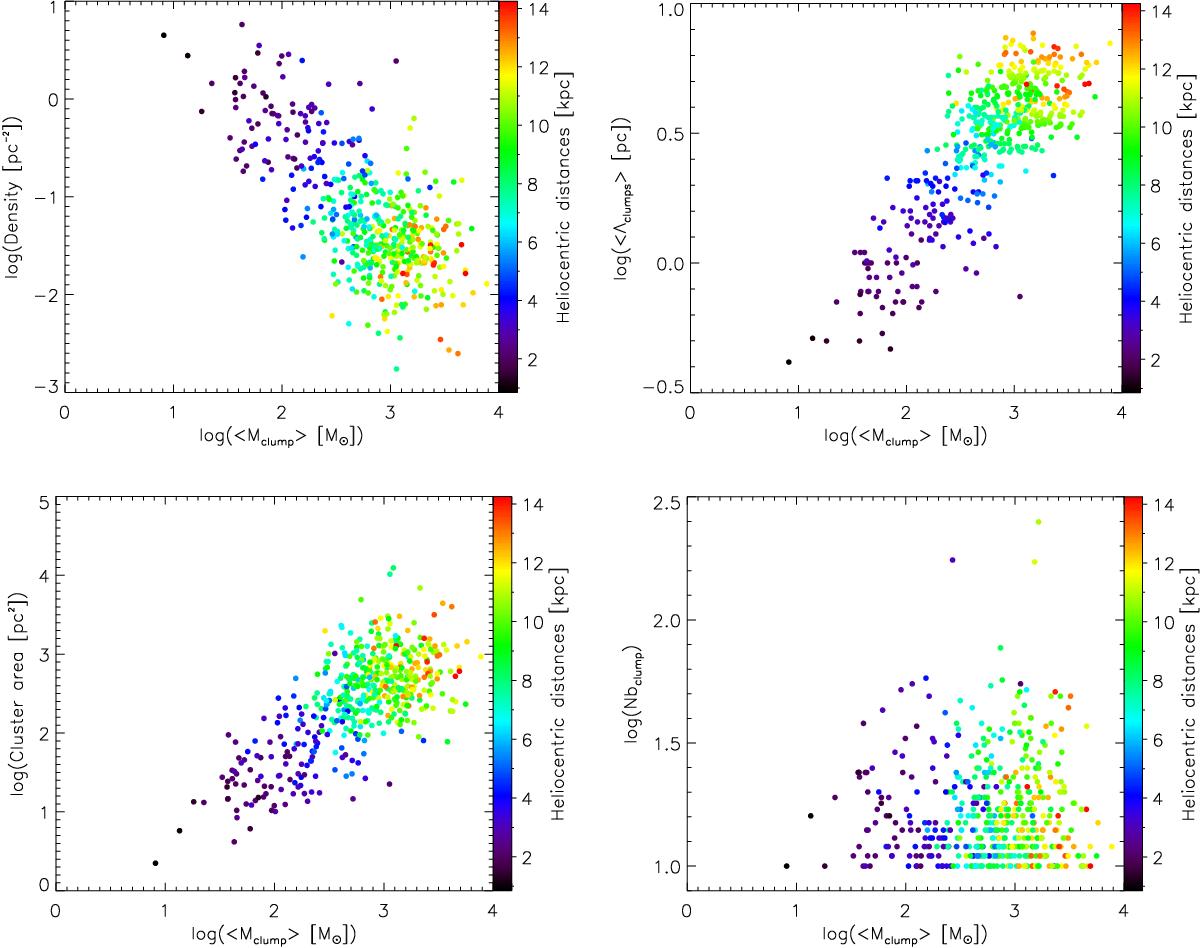
Cluster candidate properties as a function of mean clump mass. Top left: cluster density versus mean clump mass. Top right: mean MST clump length versus mean clump mass. Bottom left: cluster area versus mean clump mass. Bottom right: number of clumps versus mean clump mass. The colour bar corresponds to the heliocentric distance of the cluster candidate.
Current usage metrics show cumulative count of Article Views (full-text article views including HTML views, PDF and ePub downloads, according to the available data) and Abstracts Views on Vision4Press platform.
Data correspond to usage on the plateform after 2015. The current usage metrics is available 48-96 hours after online publication and is updated daily on week days.
Initial download of the metrics may take a while.