Fig. 14
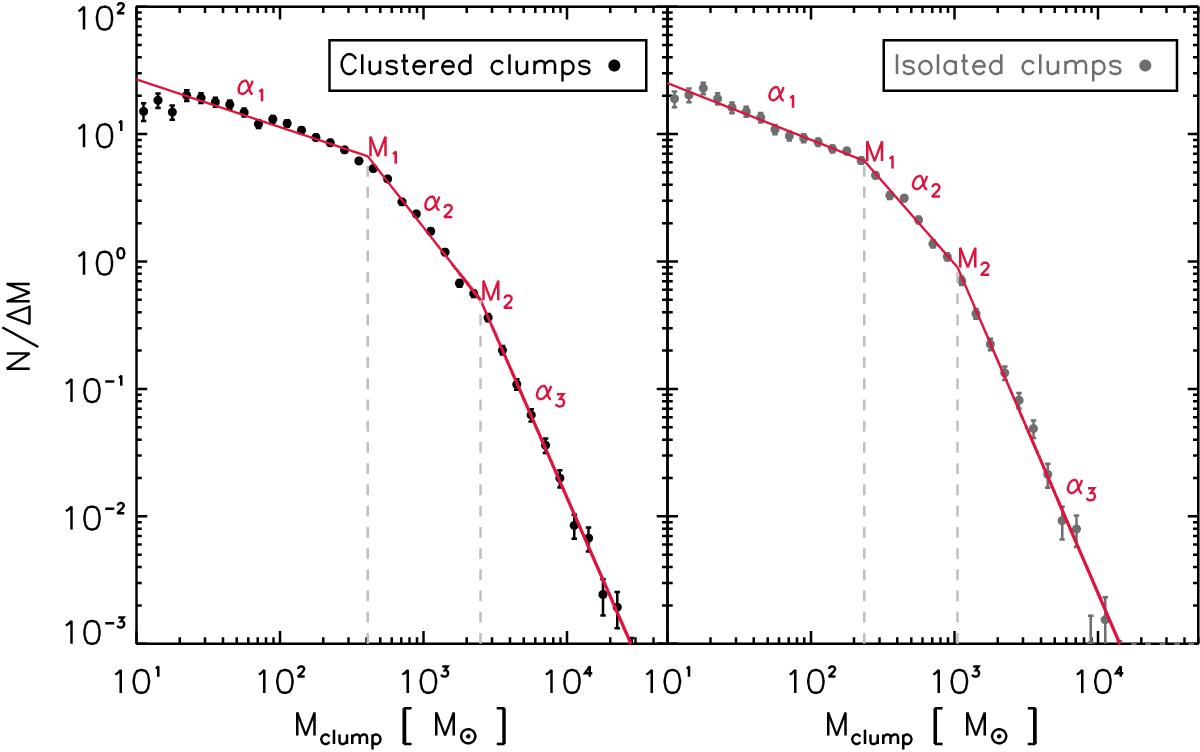
CMFs of clustered (left panel) and isolated (right panel) clumps. The masses of the clumps are computed using Eq. (6) and the ratio ![]() , where Dpeak is the distance of the cluster candidates and D the individual distance of clumps. Only clumps with HDEs are used. The two plots correspond to the function described in Eq. (7). The red lines correspond to the fitted segments of the CMF, which provide the lopes α1, α2 and α3 as well as the break masses M1 and M2.
, where Dpeak is the distance of the cluster candidates and D the individual distance of clumps. Only clumps with HDEs are used. The two plots correspond to the function described in Eq. (7). The red lines correspond to the fitted segments of the CMF, which provide the lopes α1, α2 and α3 as well as the break masses M1 and M2.
Current usage metrics show cumulative count of Article Views (full-text article views including HTML views, PDF and ePub downloads, according to the available data) and Abstracts Views on Vision4Press platform.
Data correspond to usage on the plateform after 2015. The current usage metrics is available 48-96 hours after online publication and is updated daily on week days.
Initial download of the metrics may take a while.