Fig. 11
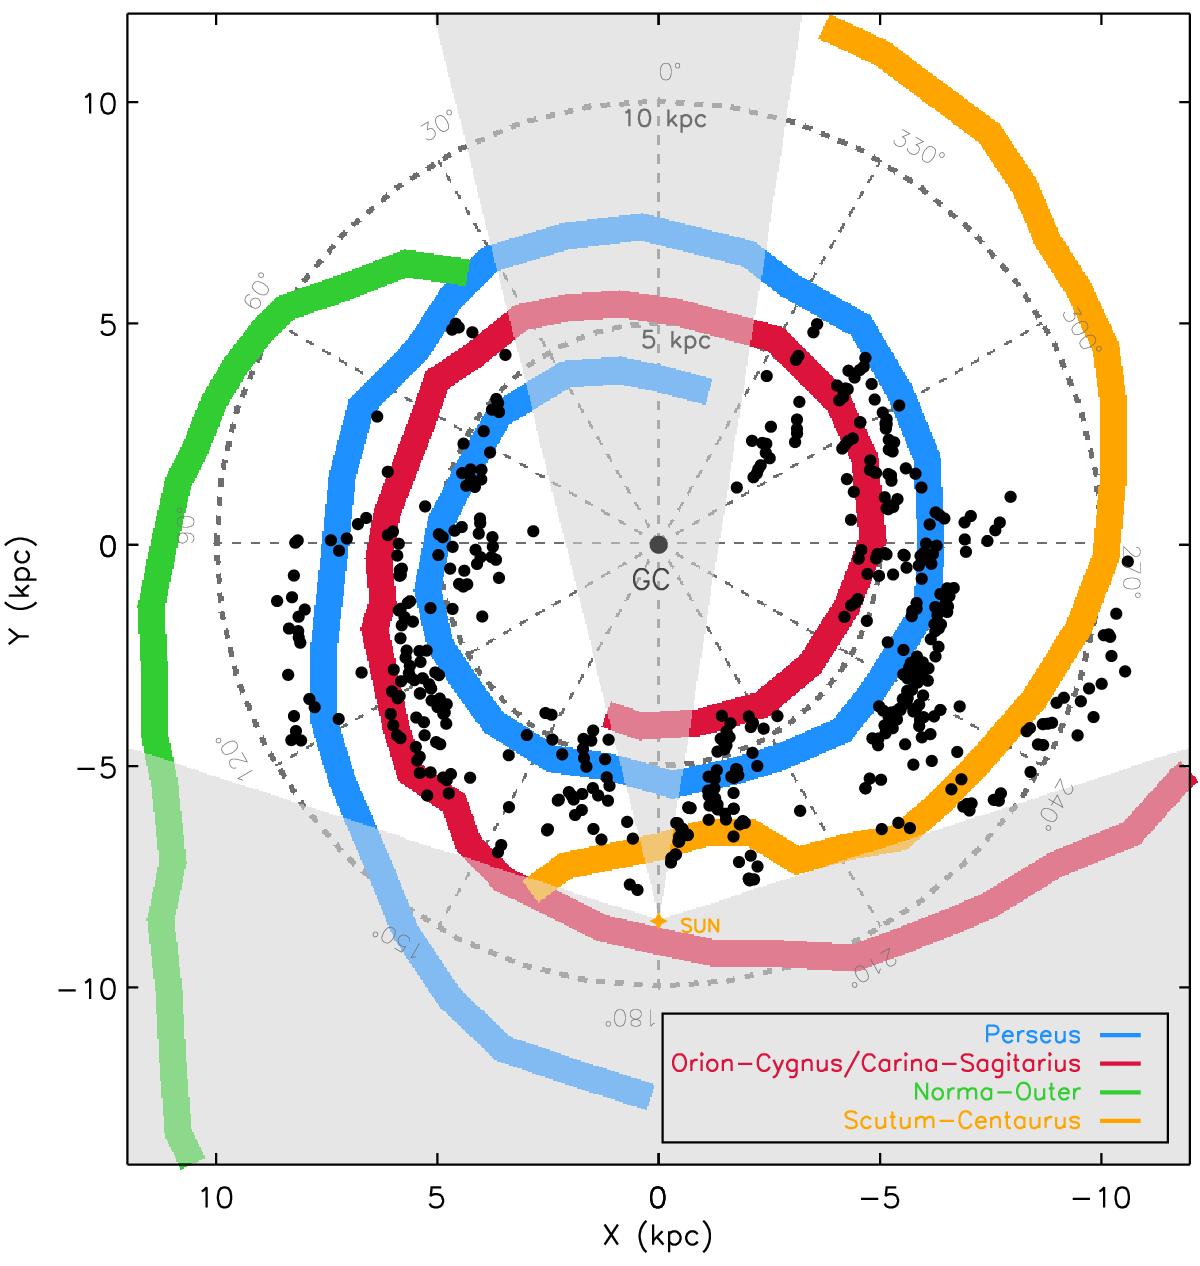
Top-down view of the Galaxy using the HDEs of the cluster candidates. The spiral arm model is supplied by Englmaier et al. (2011), with the different colour lines marking their locations. The plus (+) symbol represents the position of the Sun, with the grey dashed lines corresponding to Galactocentric distances. The black dots mark the location of the cluster candidates. The two grey shaded regions represent the regions where no cluster candidates could be found.
Current usage metrics show cumulative count of Article Views (full-text article views including HTML views, PDF and ePub downloads, according to the available data) and Abstracts Views on Vision4Press platform.
Data correspond to usage on the plateform after 2015. The current usage metrics is available 48-96 hours after online publication and is updated daily on week days.
Initial download of the metrics may take a while.