Free Access
Fig. 1
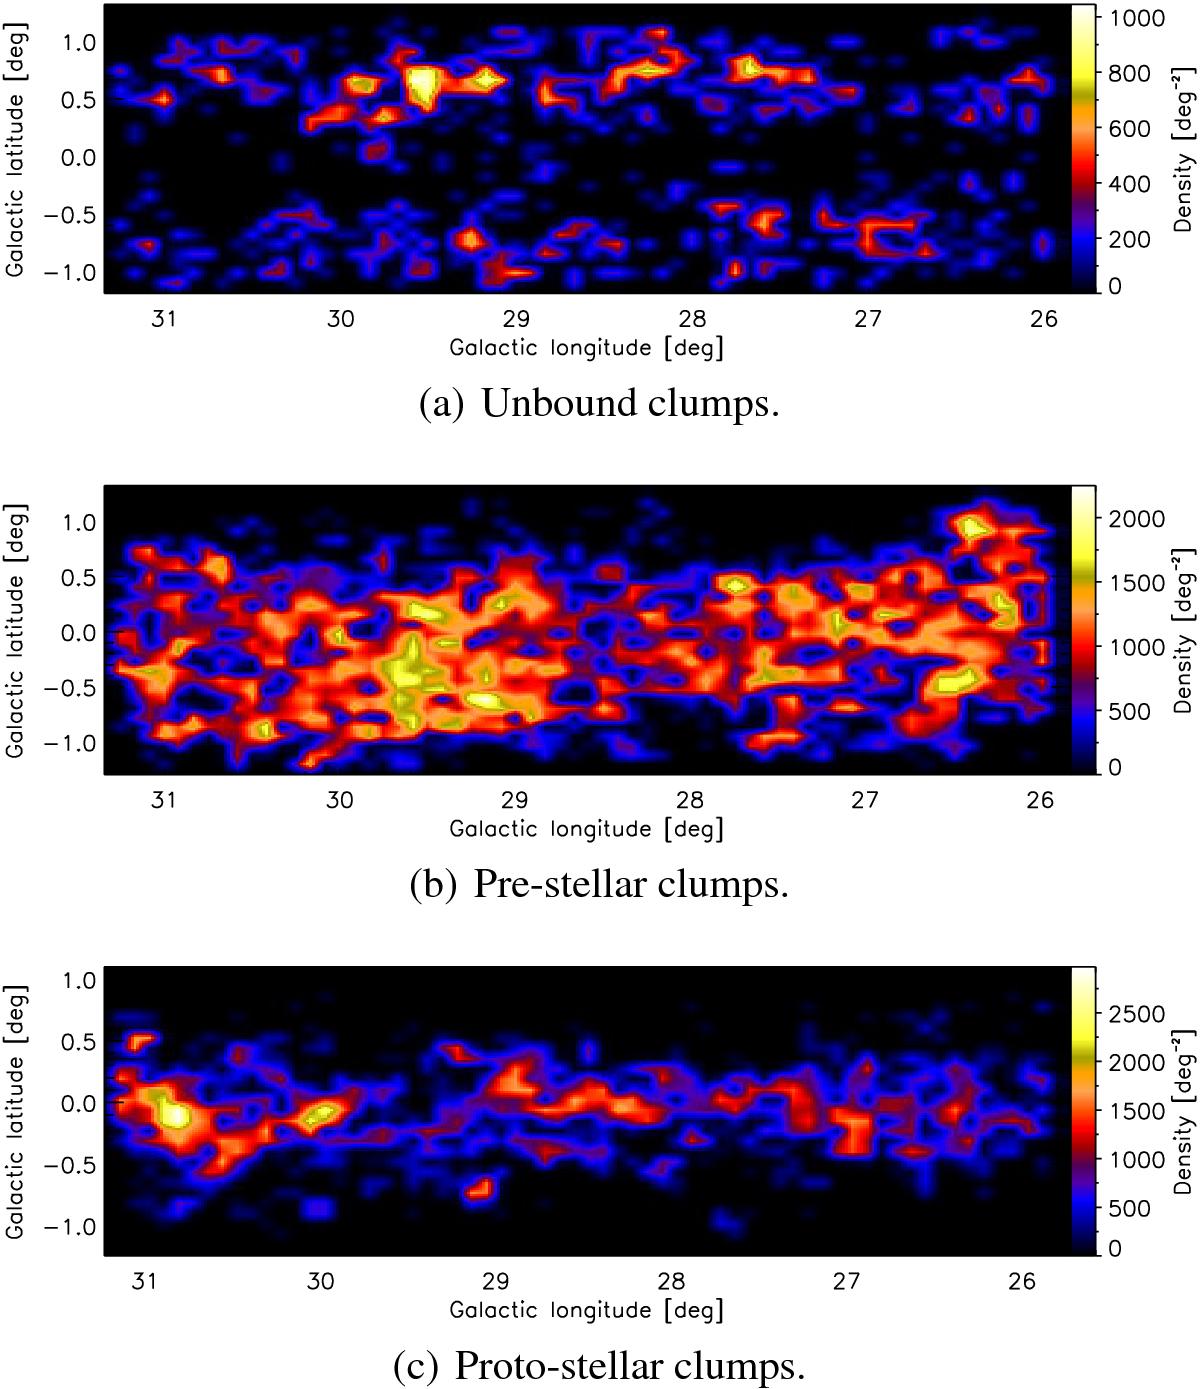
Source density maps of a sub-sample of the three different types of clumps defined in the Hi-GAL product catalogue, located in the longitude range 26 ≤l≤ 31 deg. The same distributions are observed for the whole sample.
This figure is made of several images, please see below:
Current usage metrics show cumulative count of Article Views (full-text article views including HTML views, PDF and ePub downloads, according to the available data) and Abstracts Views on Vision4Press platform.
Data correspond to usage on the plateform after 2015. The current usage metrics is available 48-96 hours after online publication and is updated daily on week days.
Initial download of the metrics may take a while.