Fig. 8
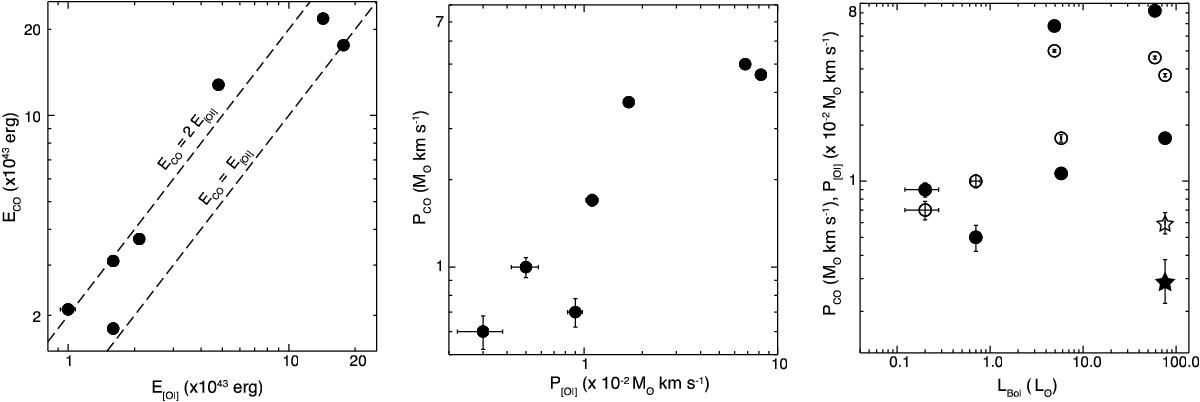
Comparison of the energy and momentum (left and center panels, respectively) derived from the analysis of the [O i] emission with the corresponding CO values from Plunkett et al. (2013), as listed in Table 3. The CO and [O i] momenta (empty and filled circles, respectively) are plotted against the embedded-source bolometric luminosities in the right-most panel. In the same panel, filled and empty stars correspond to the east-west outflow of source IRAS 2A.
Current usage metrics show cumulative count of Article Views (full-text article views including HTML views, PDF and ePub downloads, according to the available data) and Abstracts Views on Vision4Press platform.
Data correspond to usage on the plateform after 2015. The current usage metrics is available 48-96 hours after online publication and is updated daily on week days.
Initial download of the metrics may take a while.