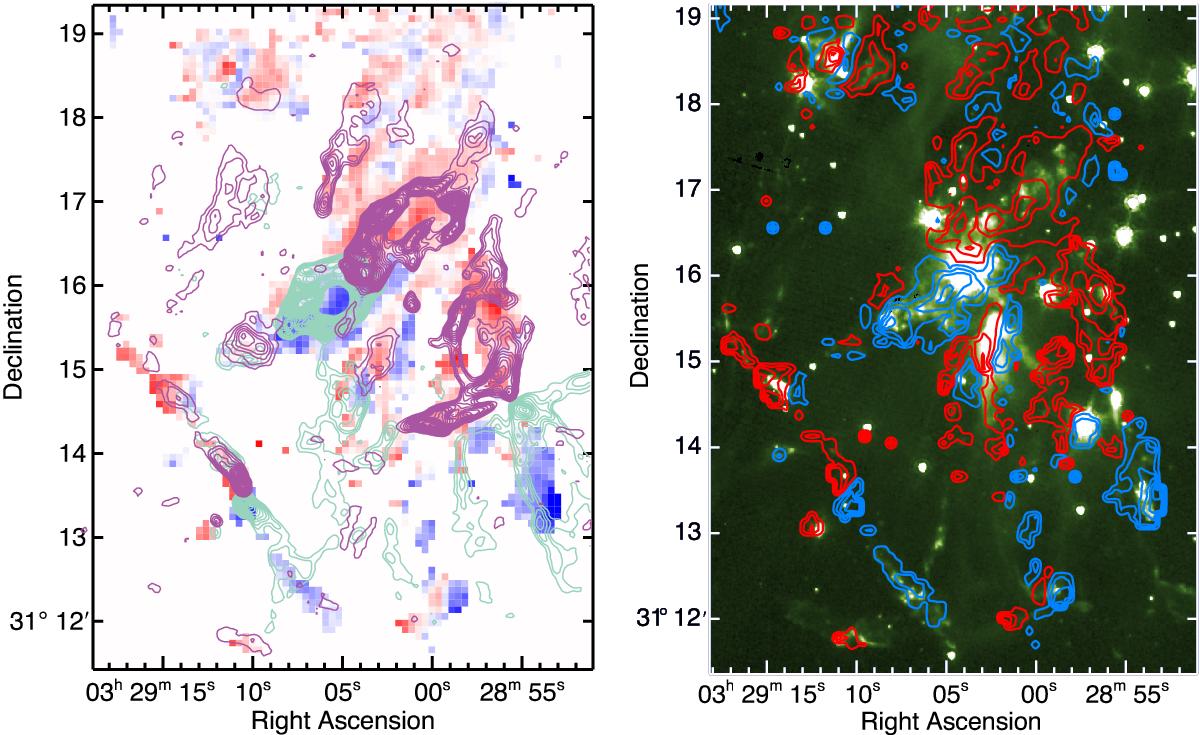
Fig. 6

Left: the outflow structures as recovered by the [O i] centroid analysis, in comparison with CO (1–0) interferometric map of Plunkett et al. (2013). Color levels are the same as in Fig. 5 and the frame focuses on the southern star-forming complex of NGC 1333. Right: [O i] line-centroid velocity shift superimposed on an IRAC 4.5 μm image showing the close spatial coincidence between the two shock tracers. Contour levels start at 5 km s-1 and increase in 10 km s-1 increments for both blue- and redshifted channels.
Current usage metrics show cumulative count of Article Views (full-text article views including HTML views, PDF and ePub downloads, according to the available data) and Abstracts Views on Vision4Press platform.
Data correspond to usage on the plateform after 2015. The current usage metrics is available 48-96 hours after online publication and is updated daily on week days.
Initial download of the metrics may take a while.


