Fig. 5
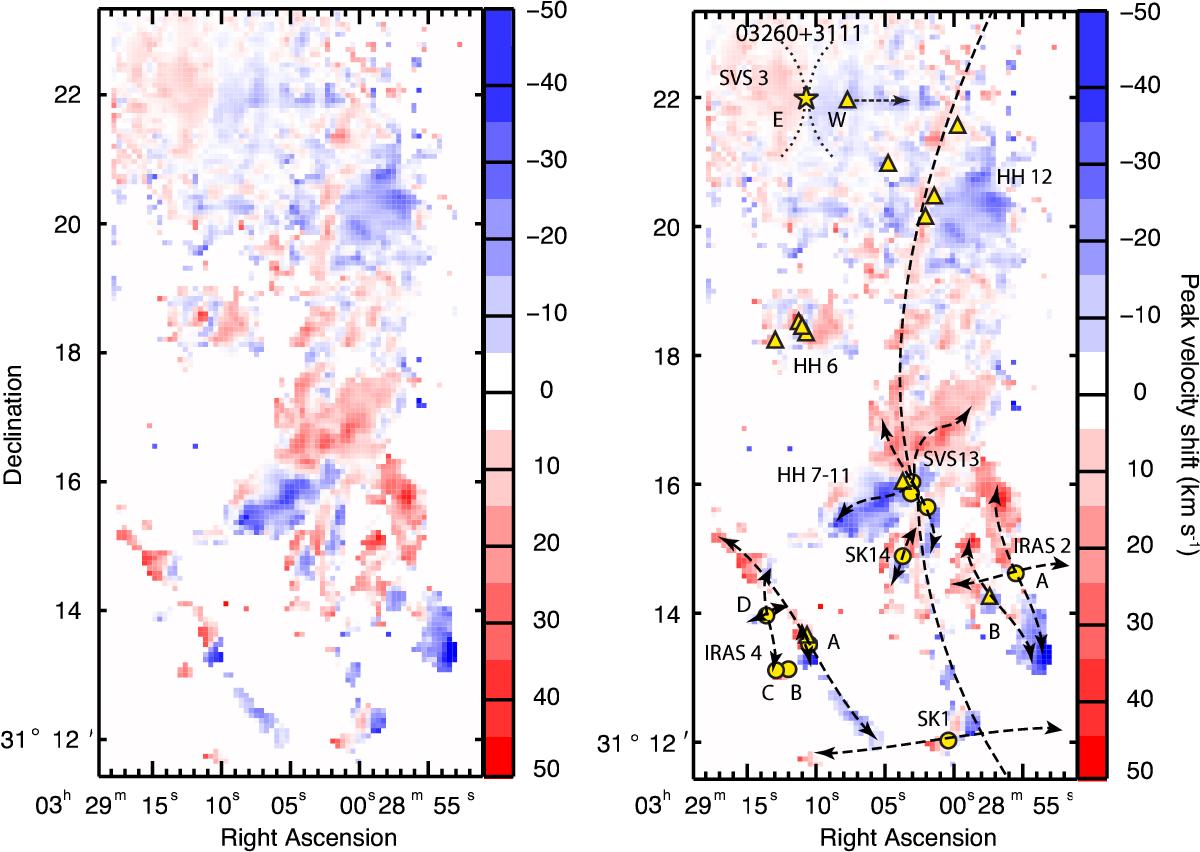
Left: map of the velocity shift observed in the [O i] line centroids with respect to its rest velocity. Color-coding for each pixel corresponds to blue – and redshifts, as indicated on the corresponding bar on the right side of the plot. Right: a finder chart based on the left-hand side map, showing outflows (dashed arrows) and embedded (Class 0 and Class I) sources (open circles and triangles, respectively). The dotted X in the north shows the borderline between the low-velocity blue- and redshifted gas tracing the photodissociative wind from IRAS 03260+3111(E) (the position of the source is marked with a star).
Current usage metrics show cumulative count of Article Views (full-text article views including HTML views, PDF and ePub downloads, according to the available data) and Abstracts Views on Vision4Press platform.
Data correspond to usage on the plateform after 2015. The current usage metrics is available 48-96 hours after online publication and is updated daily on week days.
Initial download of the metrics may take a while.