Fig. 4
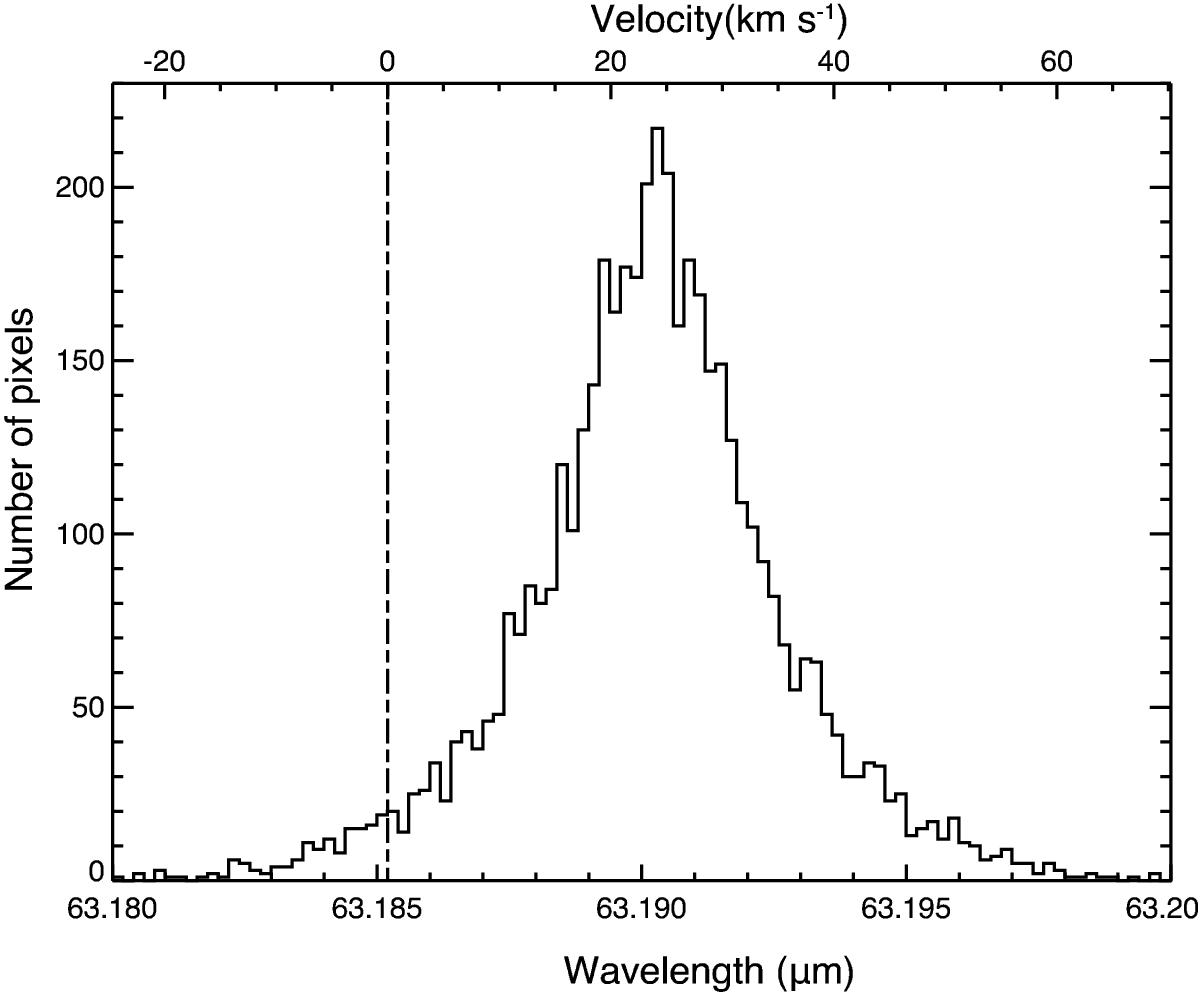
Number distribution of the [O i] line centroids running for all spaxels of the NGC 1333 map (see Fig. 1) in bins of 1 km s-1. The dashed line indicates the location of the rest wavelength for the 3P2–3P1 transition of [O i] at 63.1852 μm. The distribution is to a good approximation normal and peaks at 63 191 μm, corresponding to a velocity shift of ~24 km s-1, which is taken as the [O i] rest velocity of the system.
Current usage metrics show cumulative count of Article Views (full-text article views including HTML views, PDF and ePub downloads, according to the available data) and Abstracts Views on Vision4Press platform.
Data correspond to usage on the plateform after 2015. The current usage metrics is available 48-96 hours after online publication and is updated daily on week days.
Initial download of the metrics may take a while.