Fig. 3
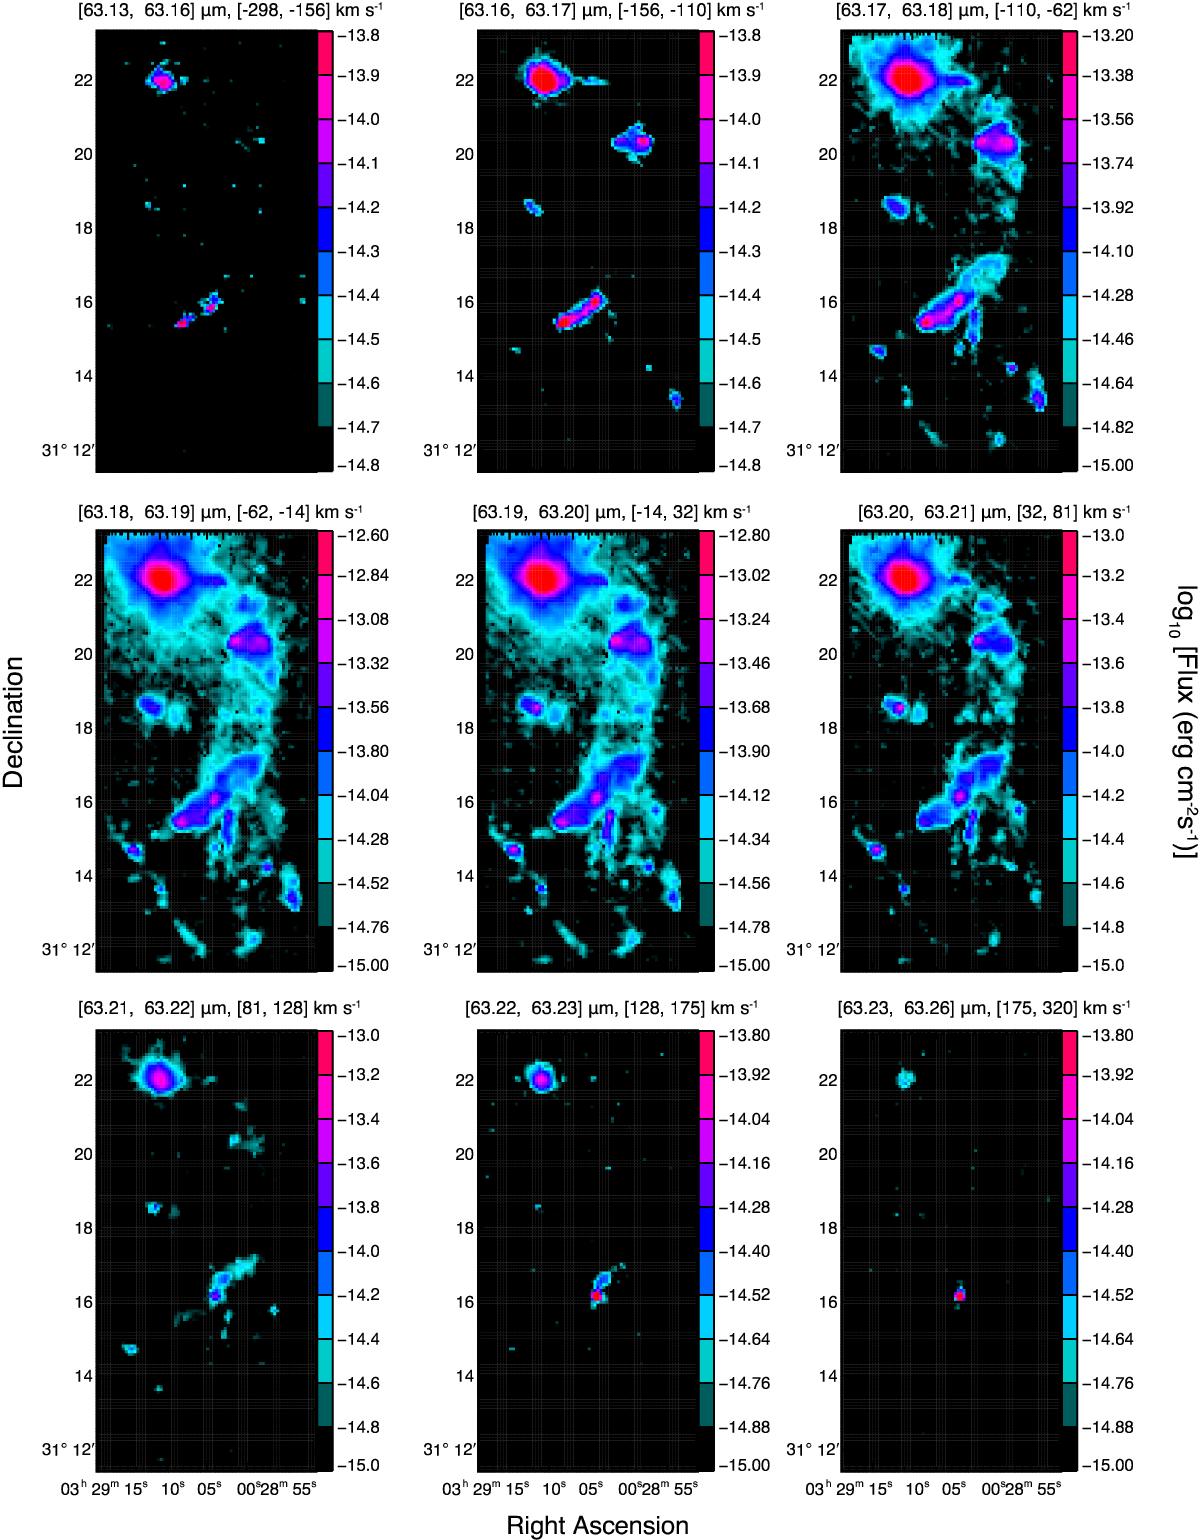
Velocity channel maps of the [O i] emission in NGC 1333. For the extreme blue- and redshifted velocity wings (top left and bottom right panels, respectively) line emission is integrated over 0.3 μm or ~140 km s-1 while for the rest of the maps channel spacing corresponds to 0.1 μm or ~45 km s-1. Integrated flux per channel is encoded in the corresponding color bars of each panel and levels are adjusted to maximize the contrast and render weaker features visible.
Current usage metrics show cumulative count of Article Views (full-text article views including HTML views, PDF and ePub downloads, according to the available data) and Abstracts Views on Vision4Press platform.
Data correspond to usage on the plateform after 2015. The current usage metrics is available 48-96 hours after online publication and is updated daily on week days.
Initial download of the metrics may take a while.