Fig. 1
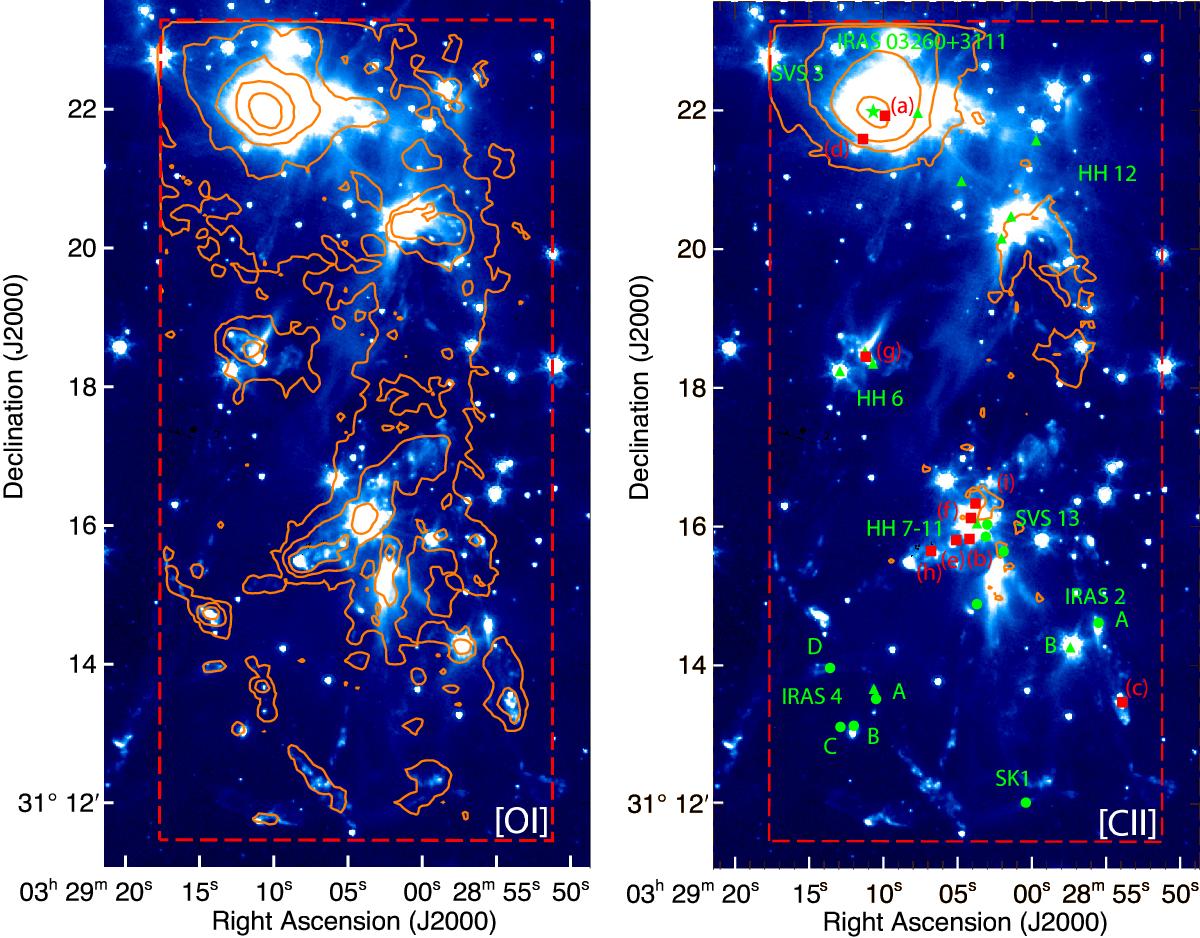
Contour maps of the integrated emission for the [O i] 63 μm and [C ii] 158 μm lines (left and right panels, respectively), superimposed on an Spitzer/IRAC image centered on 4.5 μm. The (red) dashed line delineates the boundaries of the region mapped with Herschel/PACS. In the right panel the positions of the most prominent Class 0 (green filled circles), Class I sources (green filled triangles) and outflows discussed in the text are potted for reference. Filled (red) squares labeled (a–i) correspond to positions of spectra displayed in Fig. 2. Contour levels start at 8 × 10-15 erg cm-2 s-1 and increase logarithmically in steps of 0.5 dex.
Current usage metrics show cumulative count of Article Views (full-text article views including HTML views, PDF and ePub downloads, according to the available data) and Abstracts Views on Vision4Press platform.
Data correspond to usage on the plateform after 2015. The current usage metrics is available 48-96 hours after online publication and is updated daily on week days.
Initial download of the metrics may take a while.