Fig. 8
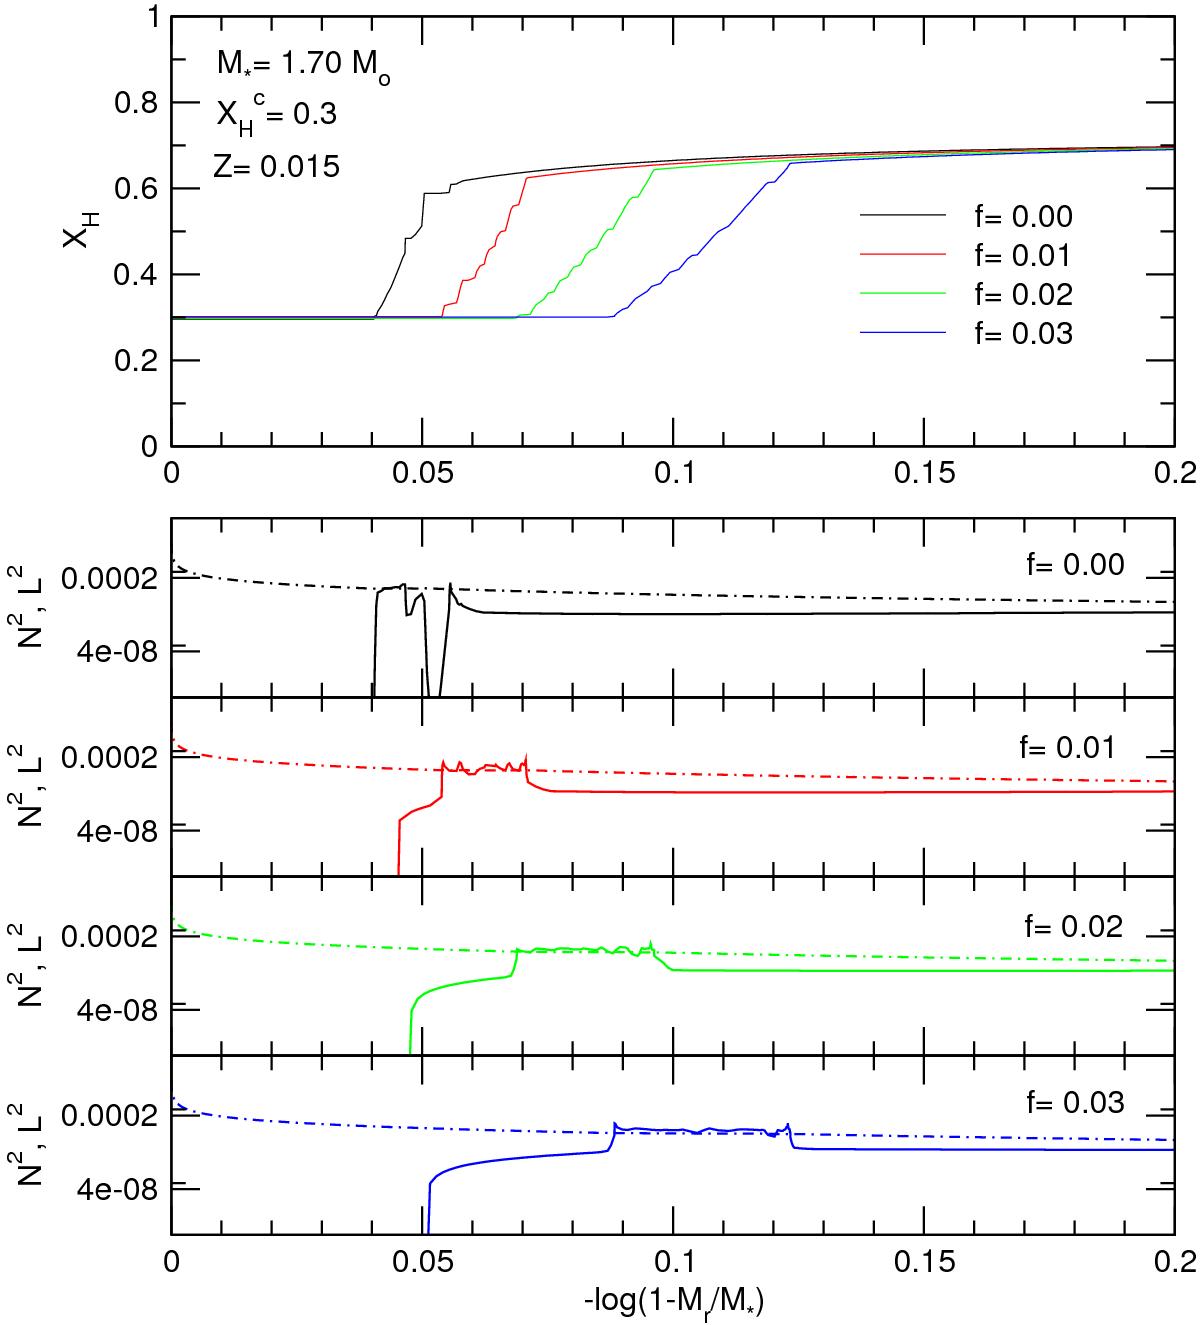
H abundance (upper panel), and the logarithm of the squared Brunt-Väisälä and Lamb frequencies (lower panels) corresponding to the stellar models with M⋆ = 1.7 M⊙, Z = 0.015, ![]() (central abundance) and different assumptions for the value of f of the convective overshooting. The location of these models in the HR diagram is marked in Fig. 3 with black dots.
(central abundance) and different assumptions for the value of f of the convective overshooting. The location of these models in the HR diagram is marked in Fig. 3 with black dots.
Current usage metrics show cumulative count of Article Views (full-text article views including HTML views, PDF and ePub downloads, according to the available data) and Abstracts Views on Vision4Press platform.
Data correspond to usage on the plateform after 2015. The current usage metrics is available 48-96 hours after online publication and is updated daily on week days.
Initial download of the metrics may take a while.