Fig. 5
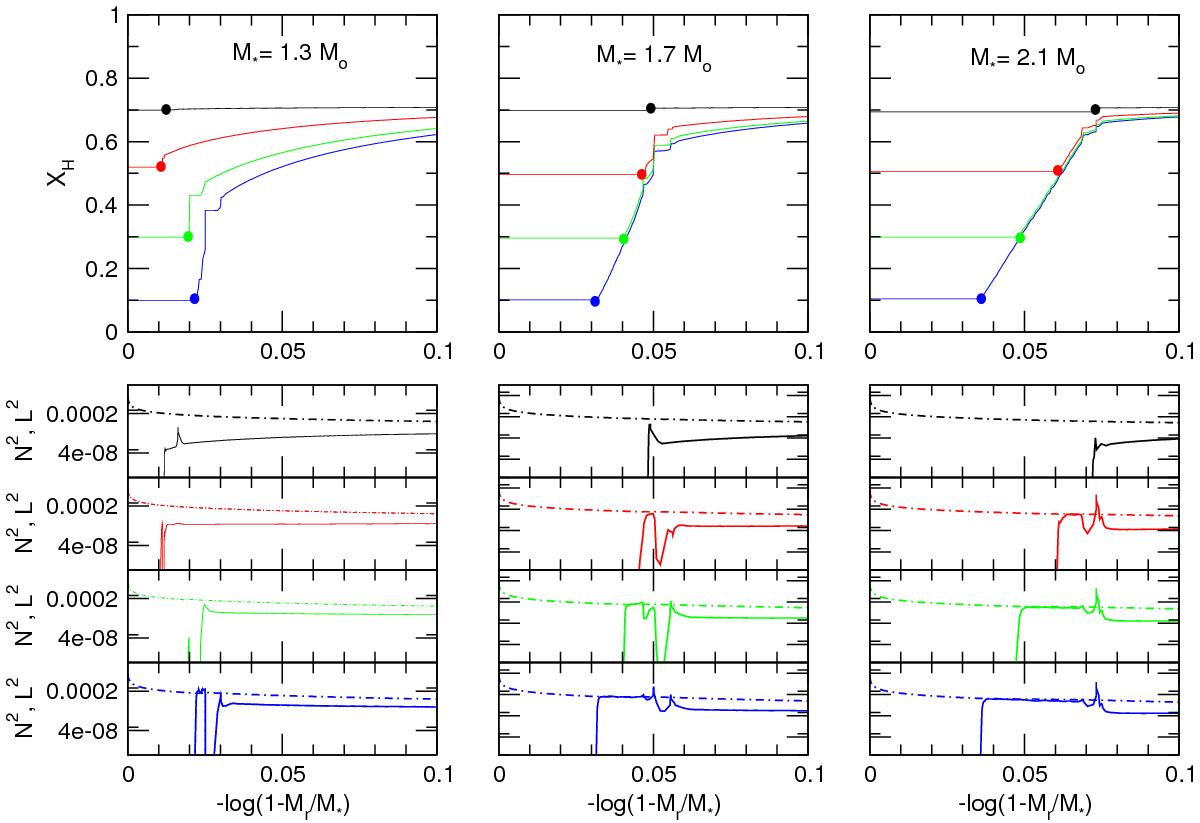
The H abundance profile (upper panels) and the squared Brunt-Väisälä frequencies (full lines) and Lamb frequencies (dashed lines) (lower panels) for M⋆ = 1.30 M⊙ (left), M⋆ = 1.70 M⊙ (center), and M⋆ = 2.10 M⊙ (right). The four different evolutionary states displayed are clearly distinguishable from the different central abundances of H (XH = 0.7,0.5,0.3,0.1). The models, which were computed with Z = 0.015 and f = 0.00, are marked in Fig. 2 with coloured dots.
Current usage metrics show cumulative count of Article Views (full-text article views including HTML views, PDF and ePub downloads, according to the available data) and Abstracts Views on Vision4Press platform.
Data correspond to usage on the plateform after 2015. The current usage metrics is available 48-96 hours after online publication and is updated daily on week days.
Initial download of the metrics may take a while.