Fig. 2
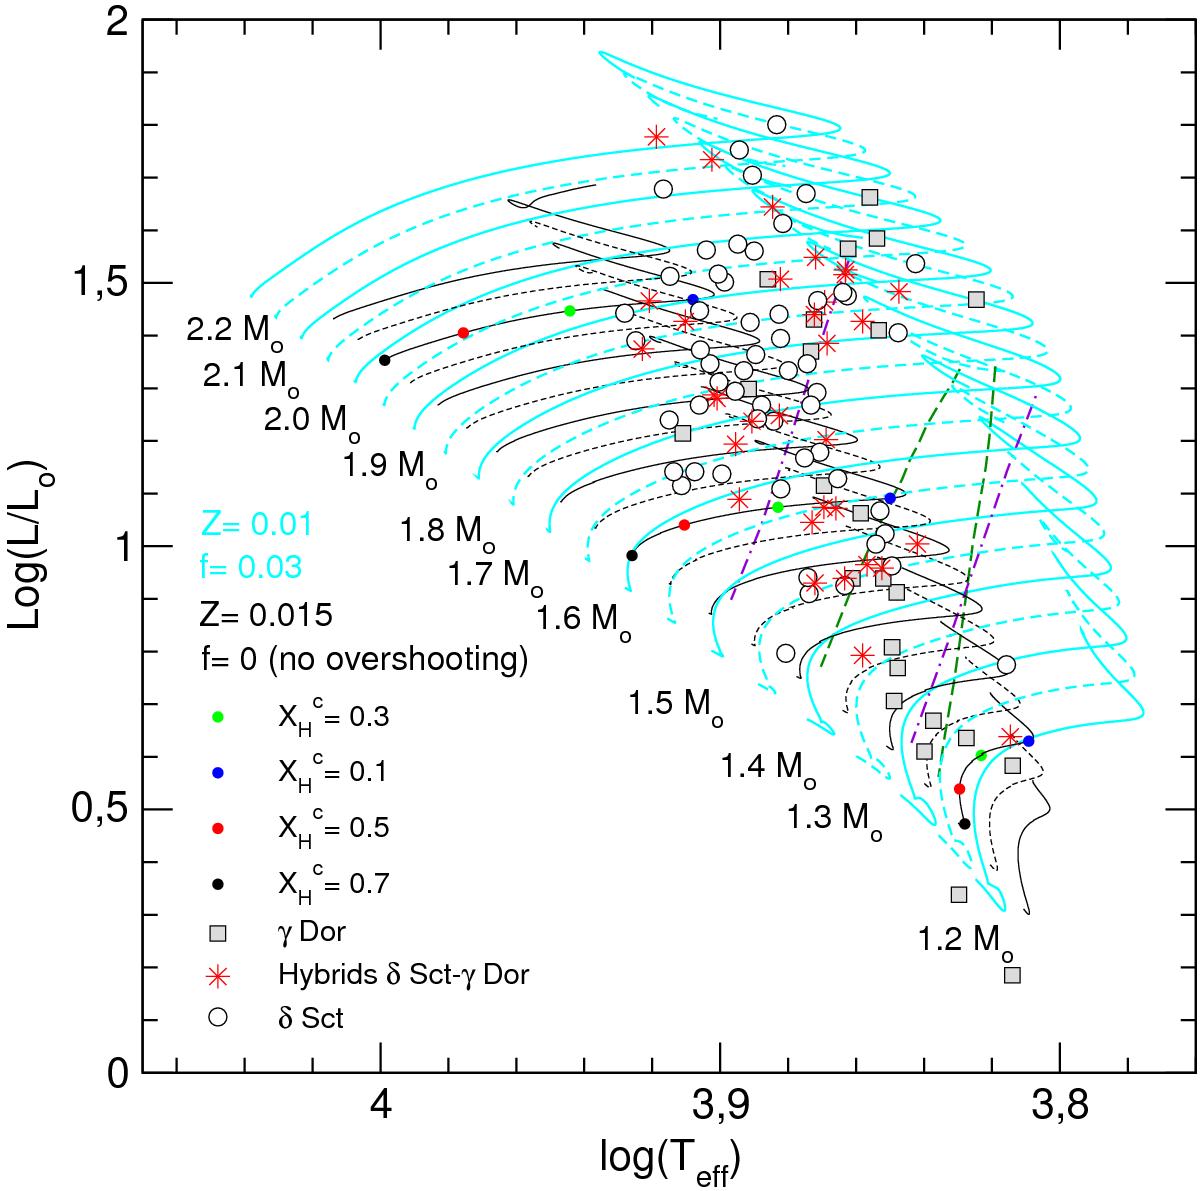
HR diagram showing evolutionary tracks for stellar models with different masses (1.2 ≤ M⋆/M⊙ ≤ 2.2), Z = 0.015 and without overshooting (f = 0) in black, and Z = 0.01 and f = 0.03 in light blue, from the ZAMS to the TAMS. The value of the stellar mass (M⋆) is indicated for a subset of the tracks (those displayed with solid lines). Black, red, green, and blue dots correspond to the location of stellar models with M⋆/M⊙ = 1.3,1.7 and 2.1 having a central H abundance of ![]() , respectively. A sample of δ Sct (open circles), γ Dor (grey squares), and hybrid δ Sct-γ Dor (red star symbols) stars taken from Grigahcène et al. (2010) are included for illustrative purposes. Also, the boundaries of the δ Sct (violet dot-dashed lines) and γ Dor (green dashed lines) theoretical instability strips from Dupret et al. (2005) are plotted.
, respectively. A sample of δ Sct (open circles), γ Dor (grey squares), and hybrid δ Sct-γ Dor (red star symbols) stars taken from Grigahcène et al. (2010) are included for illustrative purposes. Also, the boundaries of the δ Sct (violet dot-dashed lines) and γ Dor (green dashed lines) theoretical instability strips from Dupret et al. (2005) are plotted.
Current usage metrics show cumulative count of Article Views (full-text article views including HTML views, PDF and ePub downloads, according to the available data) and Abstracts Views on Vision4Press platform.
Data correspond to usage on the plateform after 2015. The current usage metrics is available 48-96 hours after online publication and is updated daily on week days.
Initial download of the metrics may take a while.