Free Access
Fig. 4
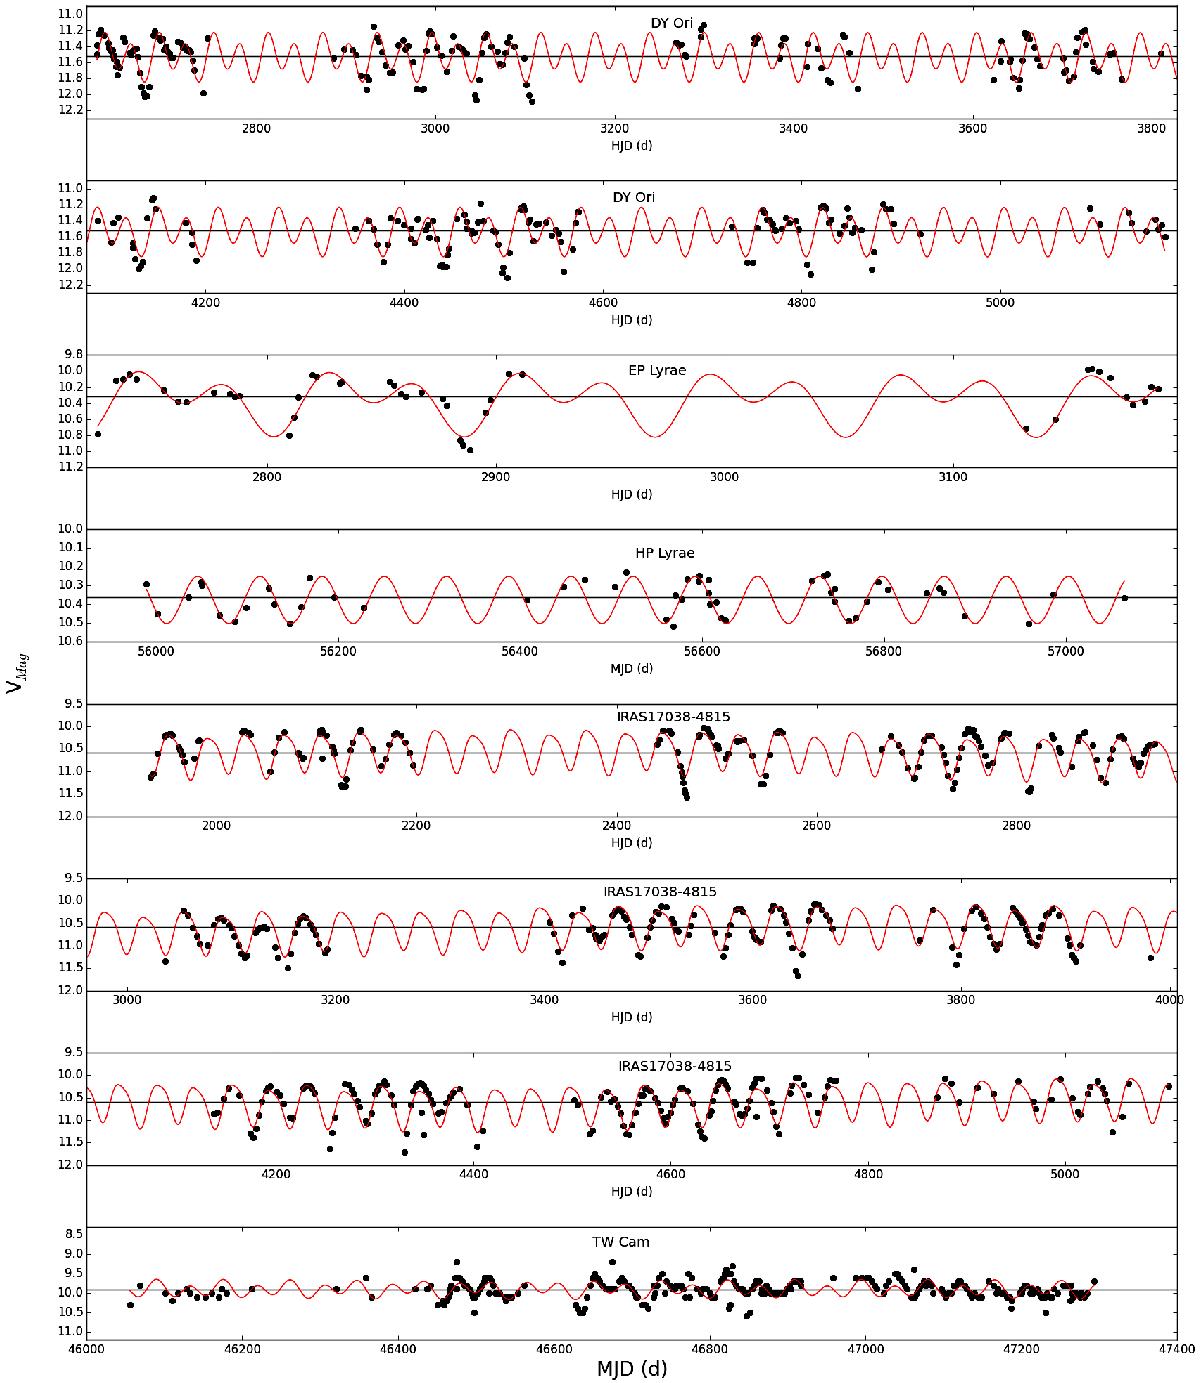
Time series of the pulsations using ASAS and AAVSO photometric data. Here we mainly display their pulsational nature and not the long-term variability. The solid red line is the pulsation model fit to the photometric time series and the horizontal solid black line is the mean Vmag.
Current usage metrics show cumulative count of Article Views (full-text article views including HTML views, PDF and ePub downloads, according to the available data) and Abstracts Views on Vision4Press platform.
Data correspond to usage on the plateform after 2015. The current usage metrics is available 48-96 hours after online publication and is updated daily on week days.
Initial download of the metrics may take a while.