Fig. 9
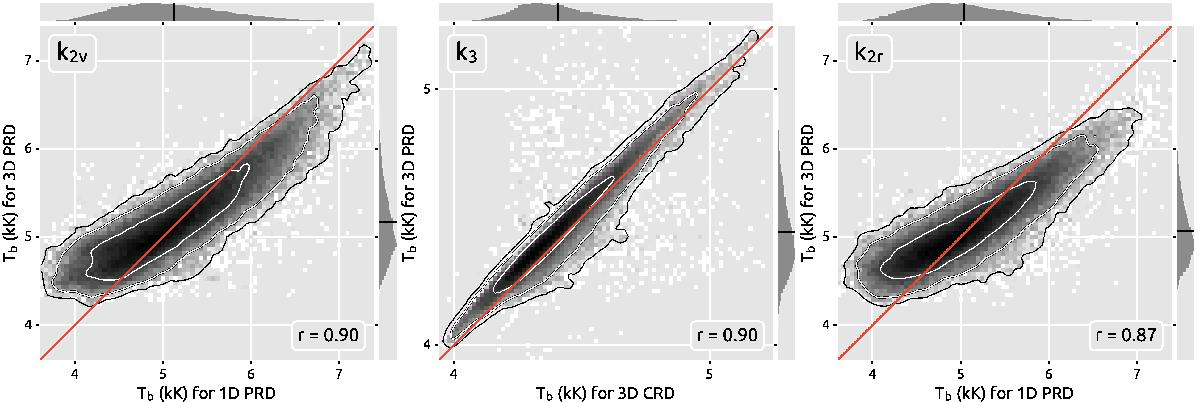
Joint probability density functions of the brightness temperature in Mg ii k2v (left), k3 (center), and k2r (right) computed in different cases. Horizontal axes are 1D PRD (left and right panels) and 3D CRD (center). Vertical axes are all 3D PRD. The color of the JPDFs displays the logarithm of the number of counts ranging from white (smallest) to black (biggest). The three nested iso-contours encompass regions with 68%, 95%, and 99% of all pixels. The red lines denote x = y. The small side plots show 1D histograms for the horizontal (top) or vertical (right) axes with mean values indicated by short black lines. The Pearson correlation coefficient r is given in an inset in each panel.
Current usage metrics show cumulative count of Article Views (full-text article views including HTML views, PDF and ePub downloads, according to the available data) and Abstracts Views on Vision4Press platform.
Data correspond to usage on the plateform after 2015. The current usage metrics is available 48-96 hours after online publication and is updated daily on week days.
Initial download of the metrics may take a while.