Fig. 8
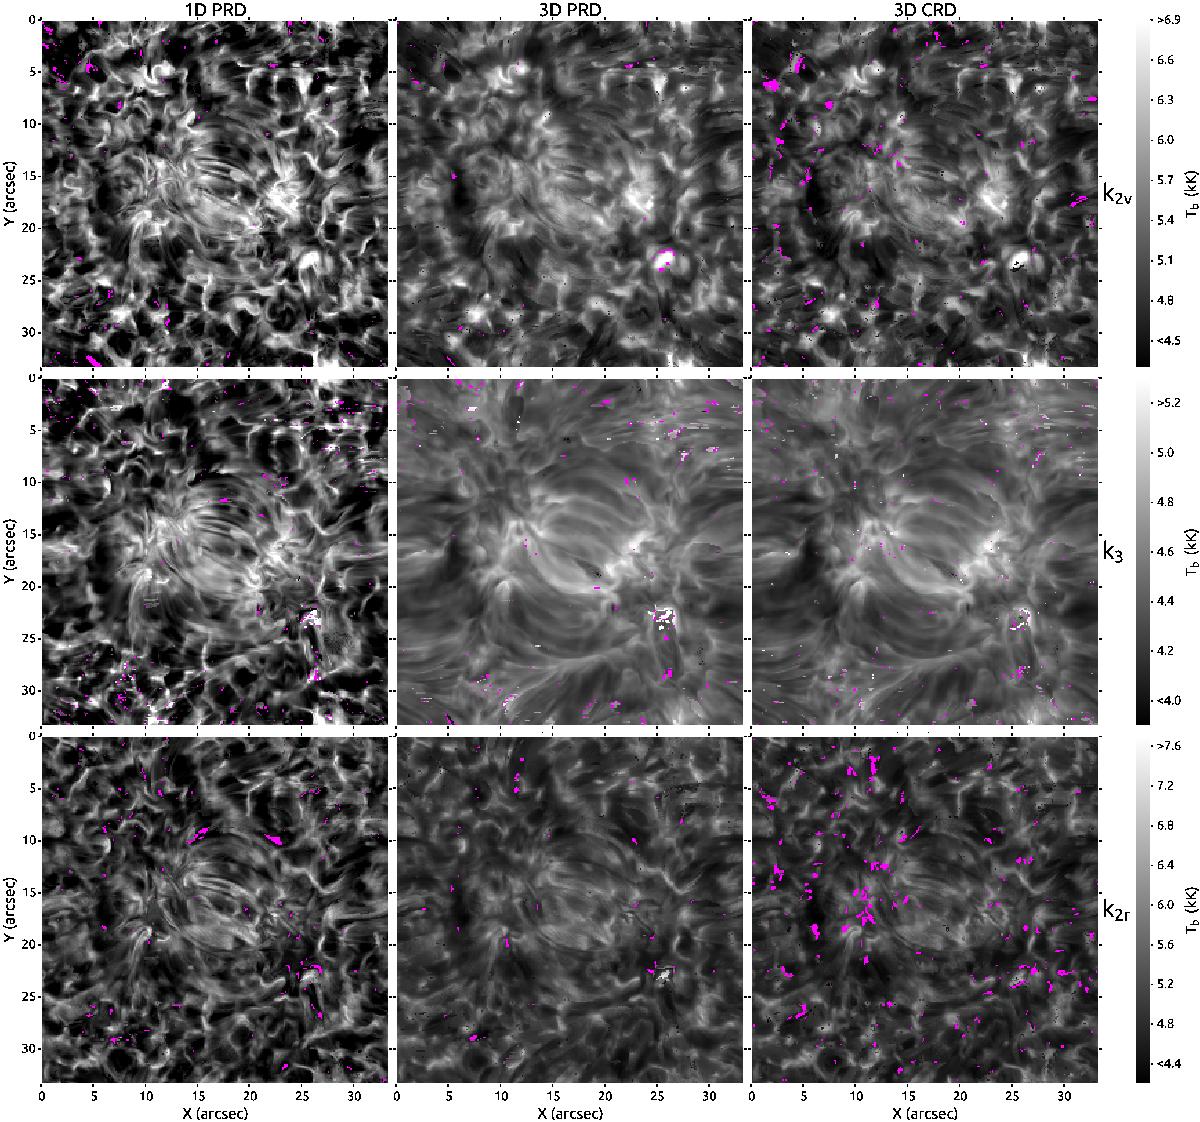
Images in the Mg ii k line computed from the 3D Bifrost snapshot at μZ = 1. Rows: blue emission peak k2v (top), central depression k3 (middle), and the red emission peak k2r (bottom). Columns: computations in 1D PRD (left), 3D PRD (middle), and 3D CRD (right). The intensity is shown as a brightness temperature: Bν(Tb) = Iν. Fuchsia-colored spots indicate coordinates where a feature is not present or misidentified. The brightness scale for all images in a row is identical and indicated in the colorbar on the right side.
Current usage metrics show cumulative count of Article Views (full-text article views including HTML views, PDF and ePub downloads, according to the available data) and Abstracts Views on Vision4Press platform.
Data correspond to usage on the plateform after 2015. The current usage metrics is available 48-96 hours after online publication and is updated daily on week days.
Initial download of the metrics may take a while.