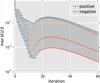
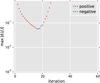
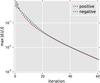
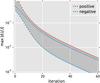
Fig. 6
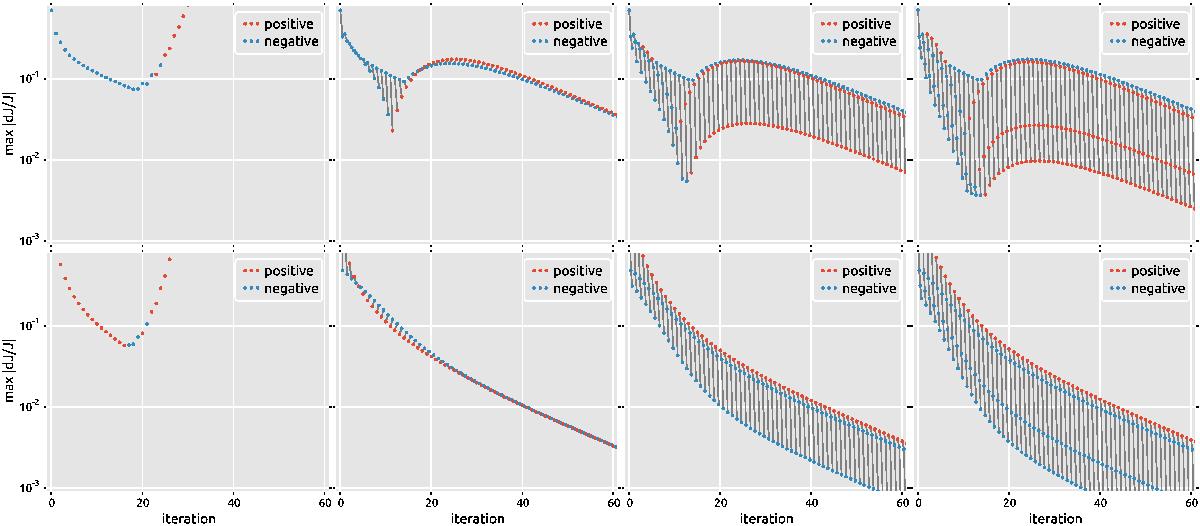
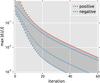
Iteration behavior of the maximum absolute relative change in mean intensity (max | δJ/J |) for the five-level Mg ii model atom with the k and the h lines treated in PRD in the FAL-C model atmosphere. Initial level populations are initialized to LTE populations (top row) or initialized using the zero-radiation approximation (bottom row). Red markers indicate a positive maxδJ/J, and blue markers indicate a negative value. Gray lines connect values of successive PRD subiterations within one ALI-iteration. The number of PRD subiterations ranges from one to four (panels from left to right).
Current usage metrics show cumulative count of Article Views (full-text article views including HTML views, PDF and ePub downloads, according to the available data) and Abstracts Views on Vision4Press platform.
Data correspond to usage on the plateform after 2015. The current usage metrics is available 48-96 hours after online publication and is updated daily on week days.
Initial download of the metrics may take a while.