Fig. 3
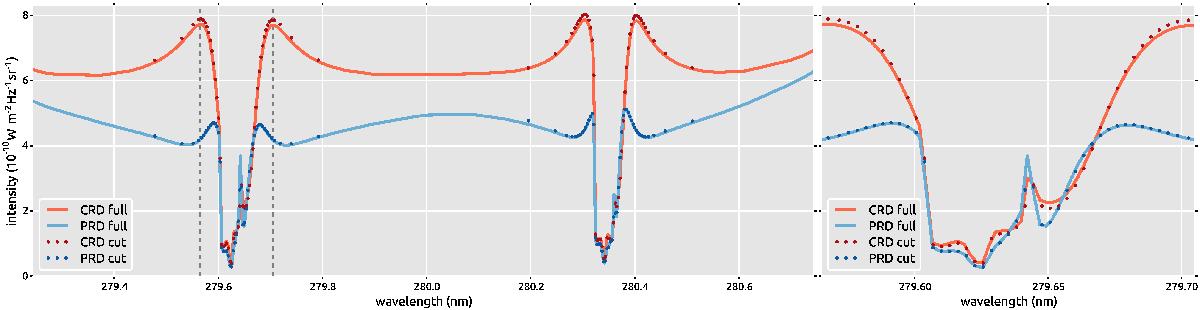
Intensity profiles of the Mg ii h&k lines at μZ = 0.953 computed on fully-winged (solid) or truncated (dots) frequency grids in CRD (red) or PRD (blue). Left: wide wavelength range showing both the k 279.6 nm and the h 280.3 nm lines. Dashed vertical lines show the wavelength range for the right panel. Right: close-up of the k line core. The model atmosphere is 1D Bifrost.
Current usage metrics show cumulative count of Article Views (full-text article views including HTML views, PDF and ePub downloads, according to the available data) and Abstracts Views on Vision4Press platform.
Data correspond to usage on the plateform after 2015. The current usage metrics is available 48-96 hours after online publication and is updated daily on week days.
Initial download of the metrics may take a while.