Free Access
Fig. 3
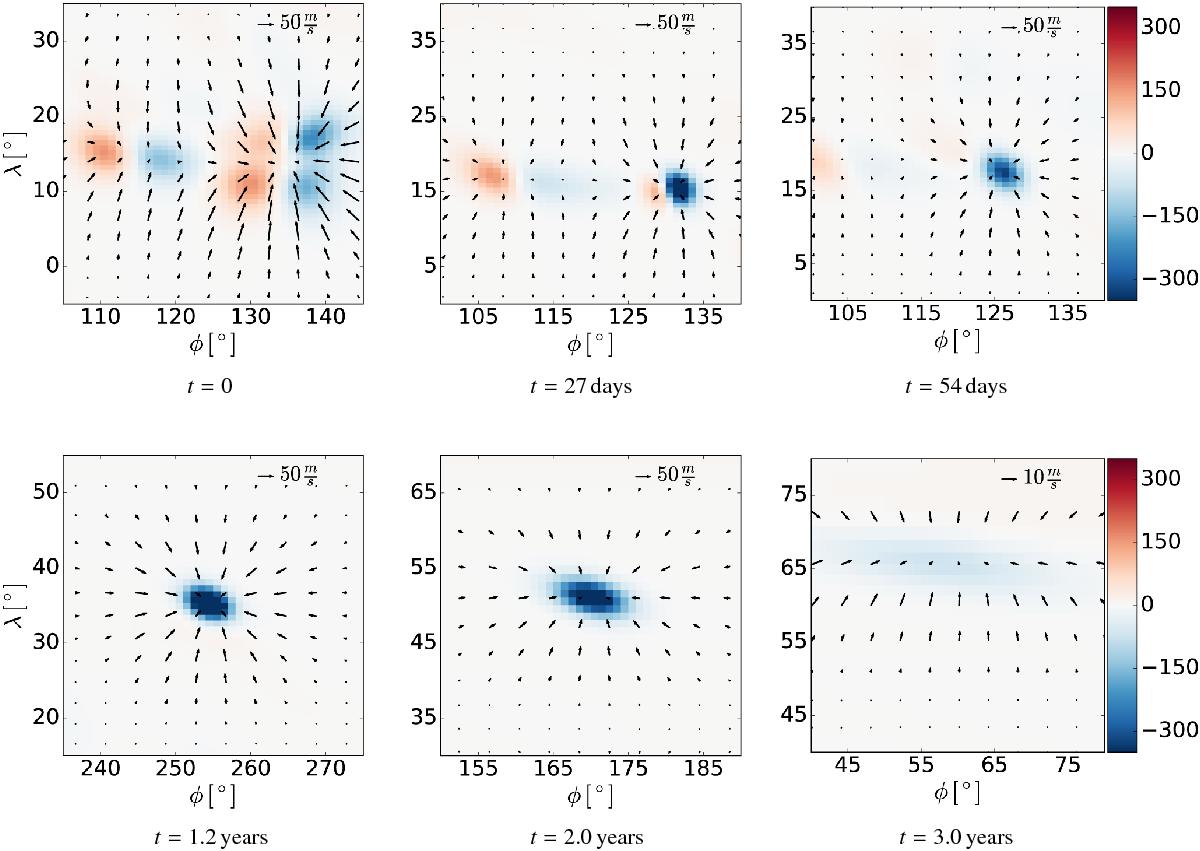
Time series showing the evolution of a long-standing, single-polarity magnetic flux clump. Time progresses from left to right and from top to bottom. The colour scale indicates the magnetic field strength in Gauss and saturates at 350 G. The arrows represent the strength and direction of the inflows.
Current usage metrics show cumulative count of Article Views (full-text article views including HTML views, PDF and ePub downloads, according to the available data) and Abstracts Views on Vision4Press platform.
Data correspond to usage on the plateform after 2015. The current usage metrics is available 48-96 hours after online publication and is updated daily on week days.
Initial download of the metrics may take a while.