Fig. 5
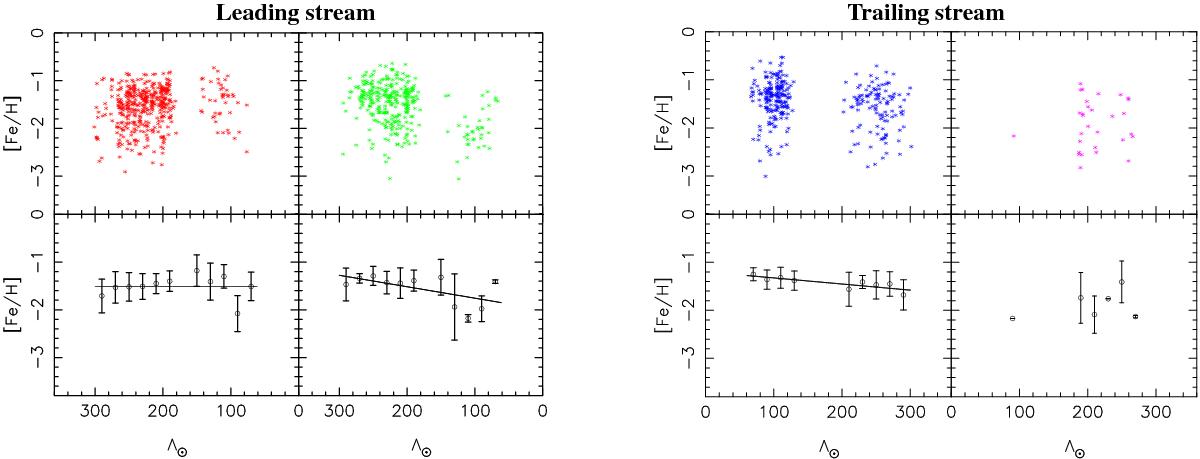
[Fe/H] of RGB stars as a function of angular distance from Sgr core along the leading stream (left panels) and trailing stream (right panels). The upper panels show the individual RGB stars. In the lower panels, the distribution of [Fe/H] is displayed as the median. The solid line shows the result of a least-squares linear fit to the median data of RGB stars.
Current usage metrics show cumulative count of Article Views (full-text article views including HTML views, PDF and ePub downloads, according to the available data) and Abstracts Views on Vision4Press platform.
Data correspond to usage on the plateform after 2015. The current usage metrics is available 48-96 hours after online publication and is updated daily on week days.
Initial download of the metrics may take a while.