Fig. 11
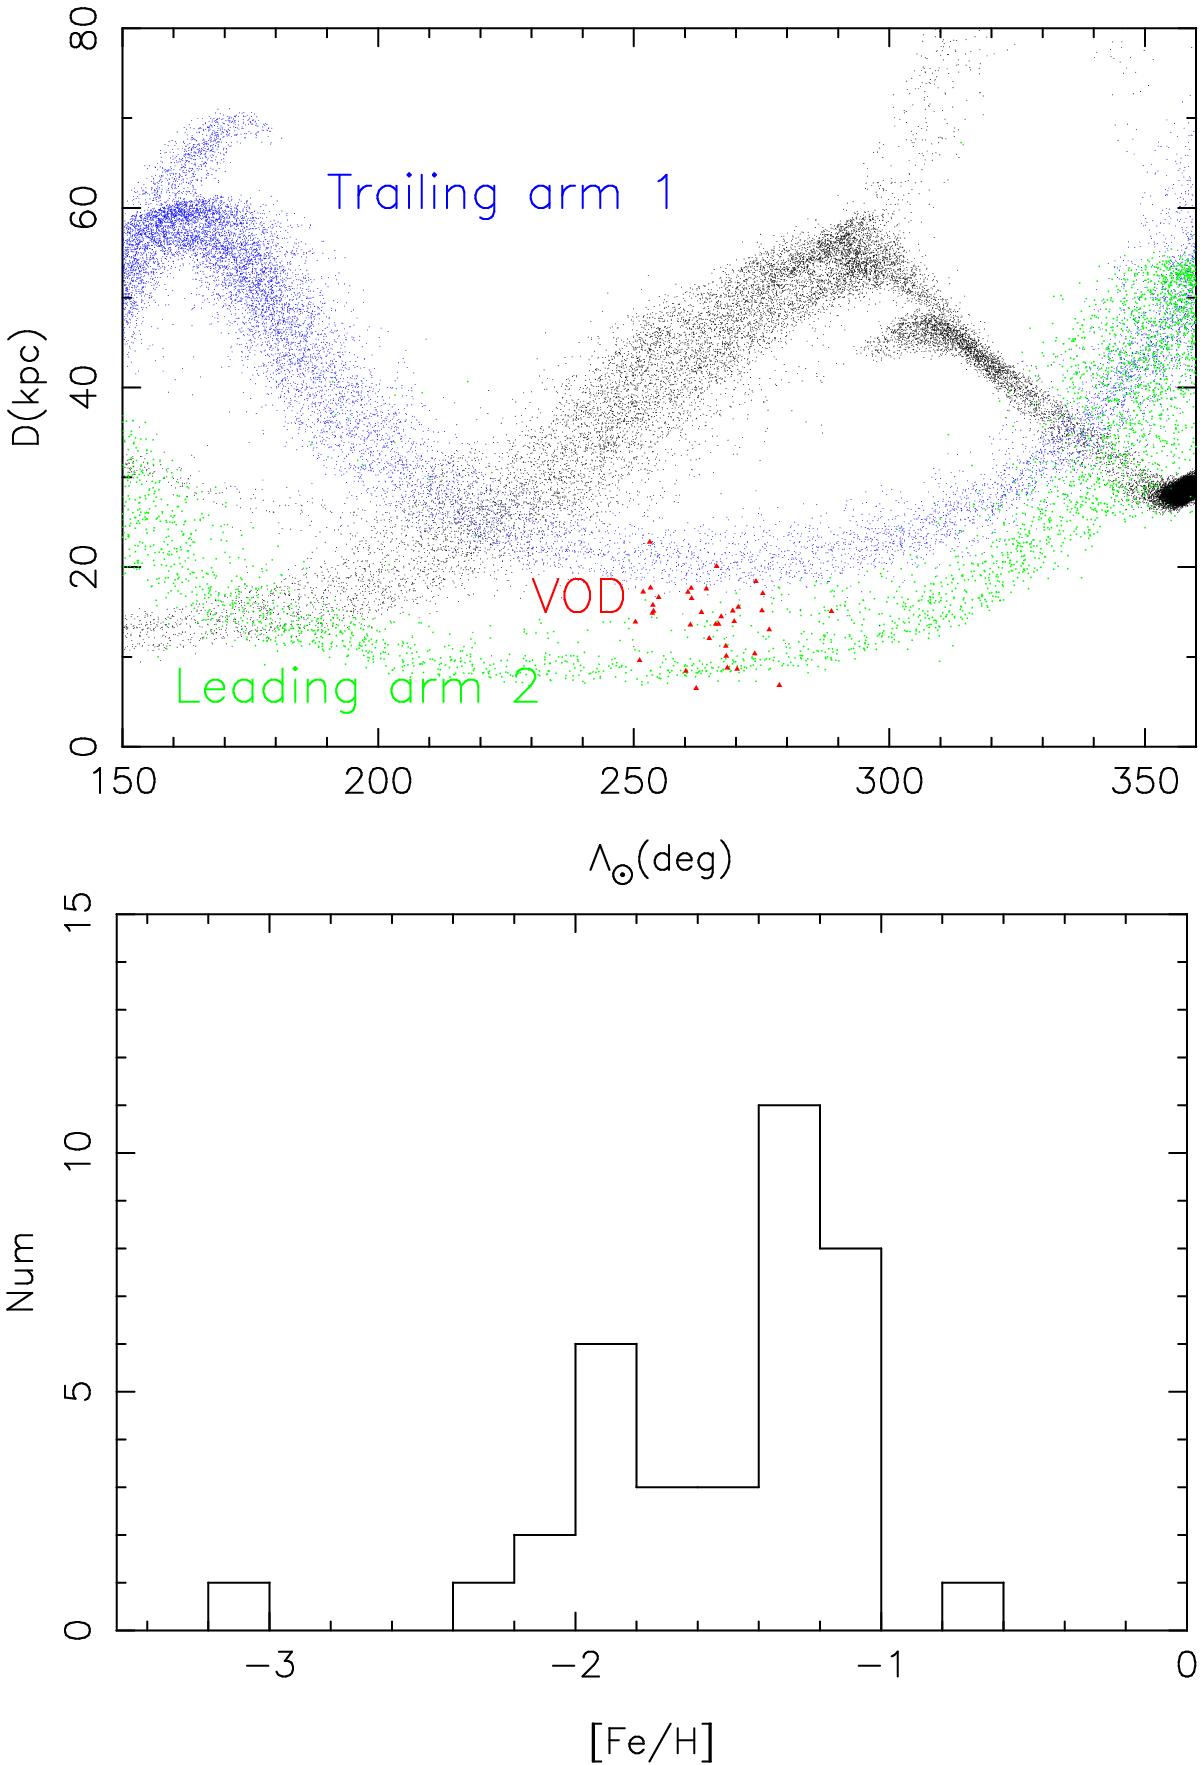
Upper panel: Λ⊙ vs. D diagram for Sgr streams and the Virgo over-density (VOD). The dots are from the Law & Majewski (2010) model. Trailing arm 1 and leading arm 2 are marked with blue and green, respectively. Red triangles show the VOD. We can see that the VOD is very near to the streams of Sgr. Lower panel: [Fe/H] distribution of 36 stars in the VOD.
Current usage metrics show cumulative count of Article Views (full-text article views including HTML views, PDF and ePub downloads, according to the available data) and Abstracts Views on Vision4Press platform.
Data correspond to usage on the plateform after 2015. The current usage metrics is available 48-96 hours after online publication and is updated daily on week days.
Initial download of the metrics may take a while.