Fig. 1
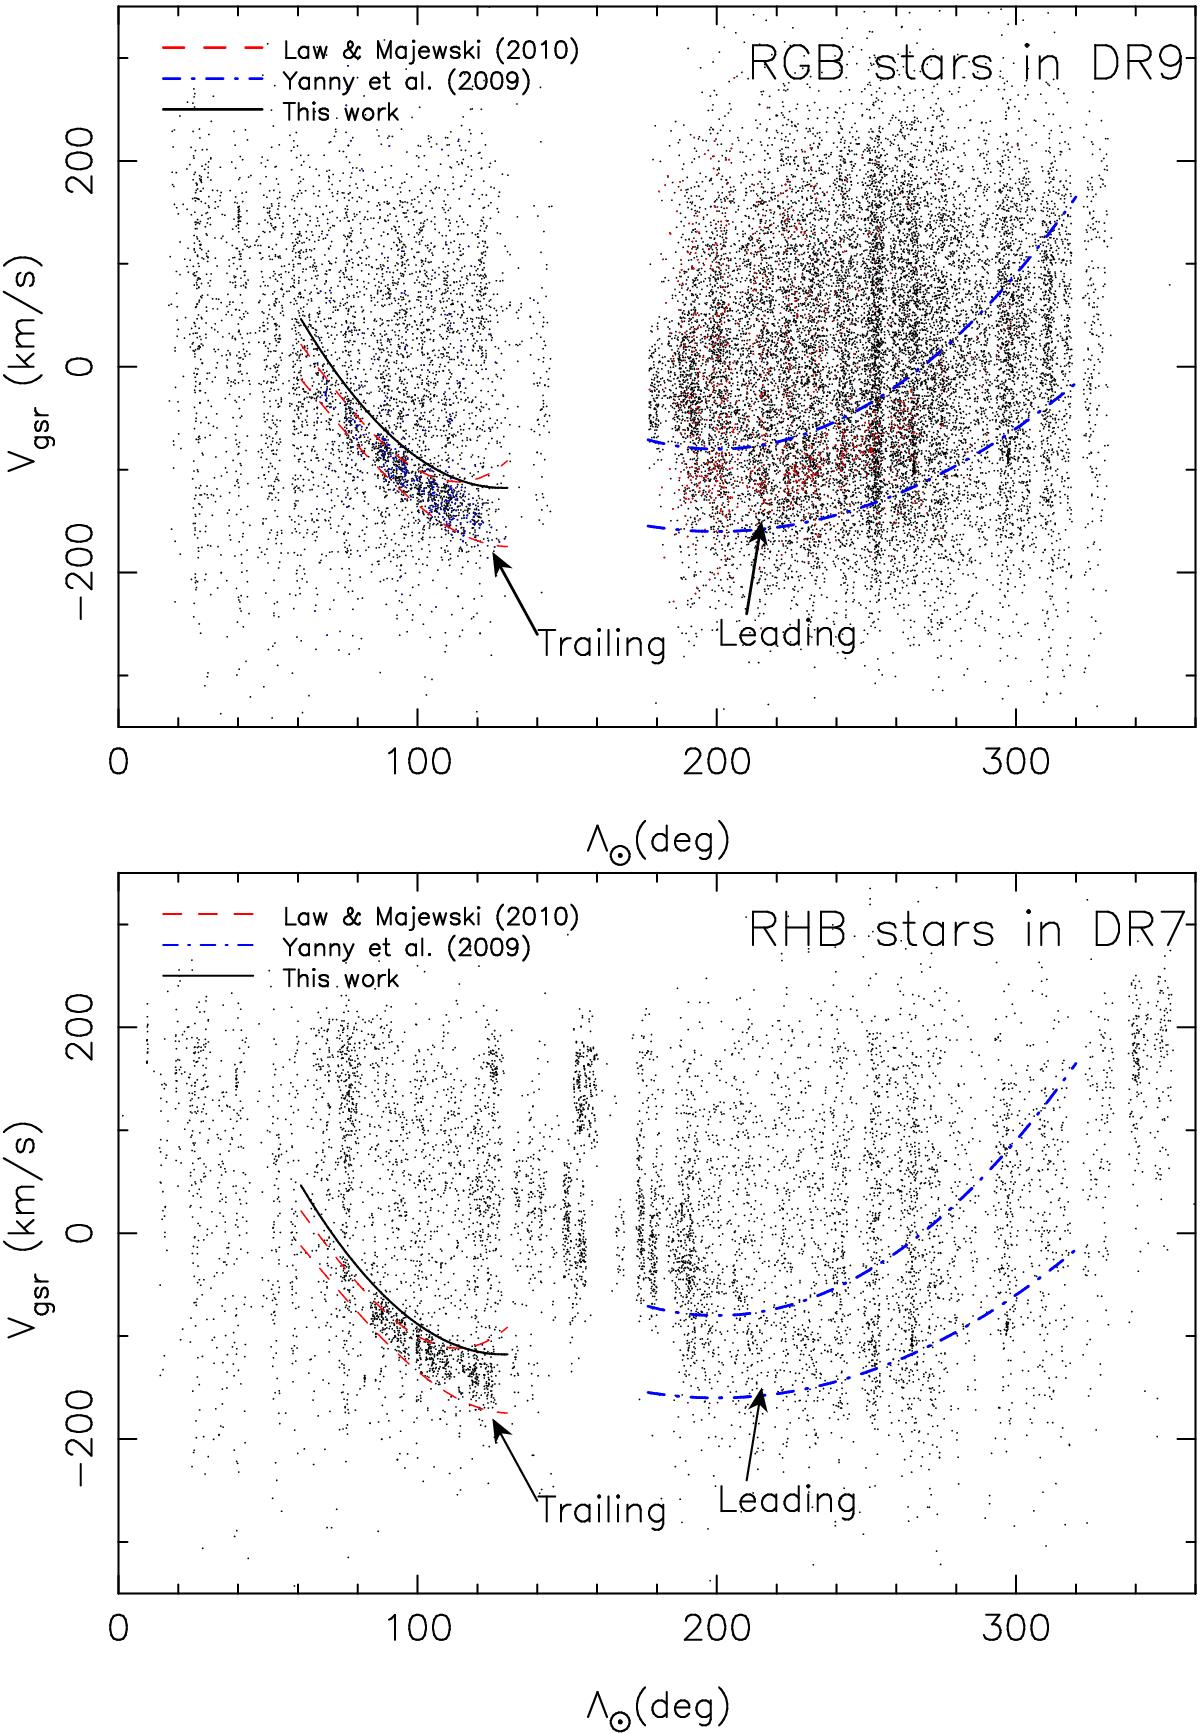
Λ⊙ vs. Vgsr diagram for RGB and RHB stars. Upper panel: the dots are ~22 000 RGB stars from SDSS DR9. The red dashed lines indicate the boundaries of the Law & Majewski (2010) model. The upper boundary of trailing arm is fitted in this work and shown by a solid line. The blue dotted and dashed lines are provided by Yanny et al. (2009). The stars with the distance cuts are shown with blue dots for the trailing stream and red dots for the leading stream. Leading arm and trailing arm are also labelled. Lower panel: same as upper panel but for 8535 RHB stars.
Current usage metrics show cumulative count of Article Views (full-text article views including HTML views, PDF and ePub downloads, according to the available data) and Abstracts Views on Vision4Press platform.
Data correspond to usage on the plateform after 2015. The current usage metrics is available 48-96 hours after online publication and is updated daily on week days.
Initial download of the metrics may take a while.