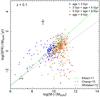
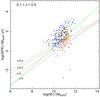
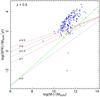
Fig. 5

Distribution of the 1146 galaxies in the log (SFR)–log (M⋆) plane. The colour coding shows the age of the population where blue indicates galaxies with young stellar populations (<3 Gyr), green indicates galaxies that have stellar populations with age between 3–5 Gyr, orange shows galaxies with stellar population ages between 5–9 Gyr and red shows galaxies with stellar populations older than 9 Gyr. Note that the stellar age indicates the oldest stars in a galaxy and does not exclude the existence of younger stellar populations. Additionally, the stellar age is characterised by high uncertainties and should be treated with caution, see text for more details. The error bars show the median uncertainty for the stellar mass and SFR measurements, 25% and 50% respectively. The green and black lines, plotted in all the panels, are from Elbaz et al. (2011) and Chang et al. (2015) and represent the SFR-M∗ relation for the local Universe. In the middle panel the red dashed lines represent the MS at redshifts 0, 0.3 and 0.5, while in the right panel at redshifts 1, 1.5, 2, 2.5. The red lines are from Whitaker et al. (2012).
Current usage metrics show cumulative count of Article Views (full-text article views including HTML views, PDF and ePub downloads, according to the available data) and Abstracts Views on Vision4Press platform.
Data correspond to usage on the plateform after 2015. The current usage metrics is available 48-96 hours after online publication and is updated daily on week days.
Initial download of the metrics may take a while.