Fig. 4
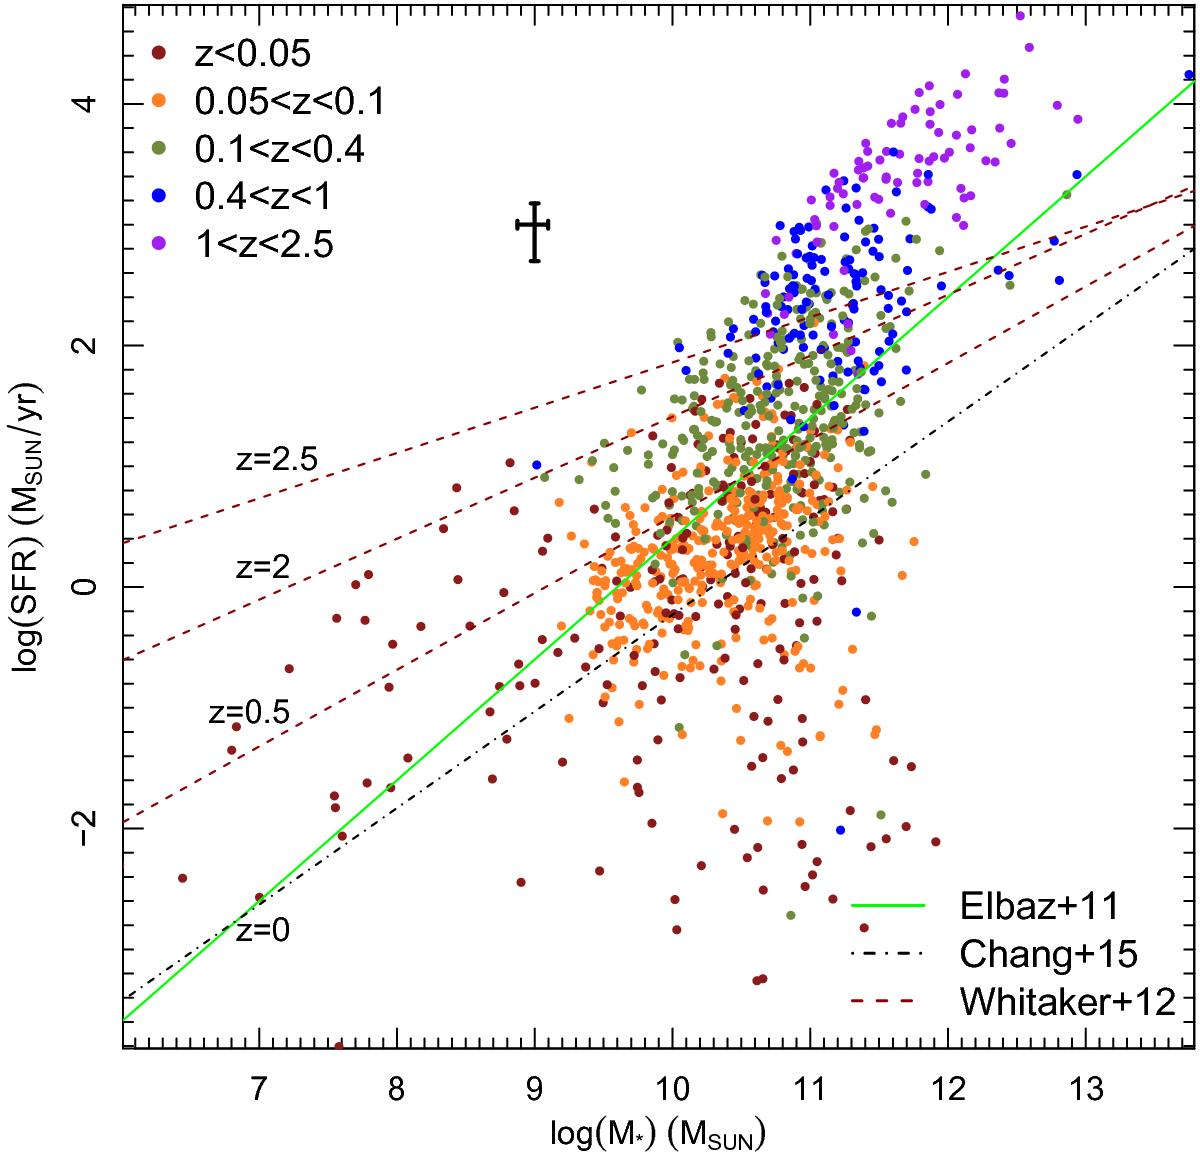
Full sample of 1146 galaxies. The colour denotes the redshift bin of each galaxy. The lines indicate the main sequence (MS) of star formation as measured by three independent studies at four different redshifts. Note that both the black and green lines are at redshift zero. The error bars show the median uncertainty for the stellar mass and SFR measurements, 25% and 50%, respectively.
Current usage metrics show cumulative count of Article Views (full-text article views including HTML views, PDF and ePub downloads, according to the available data) and Abstracts Views on Vision4Press platform.
Data correspond to usage on the plateform after 2015. The current usage metrics is available 48-96 hours after online publication and is updated daily on week days.
Initial download of the metrics may take a while.