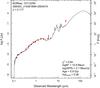
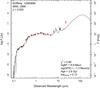
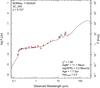
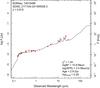
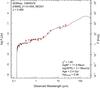
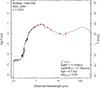
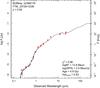
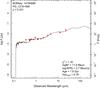
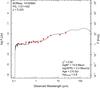
Fig. 2
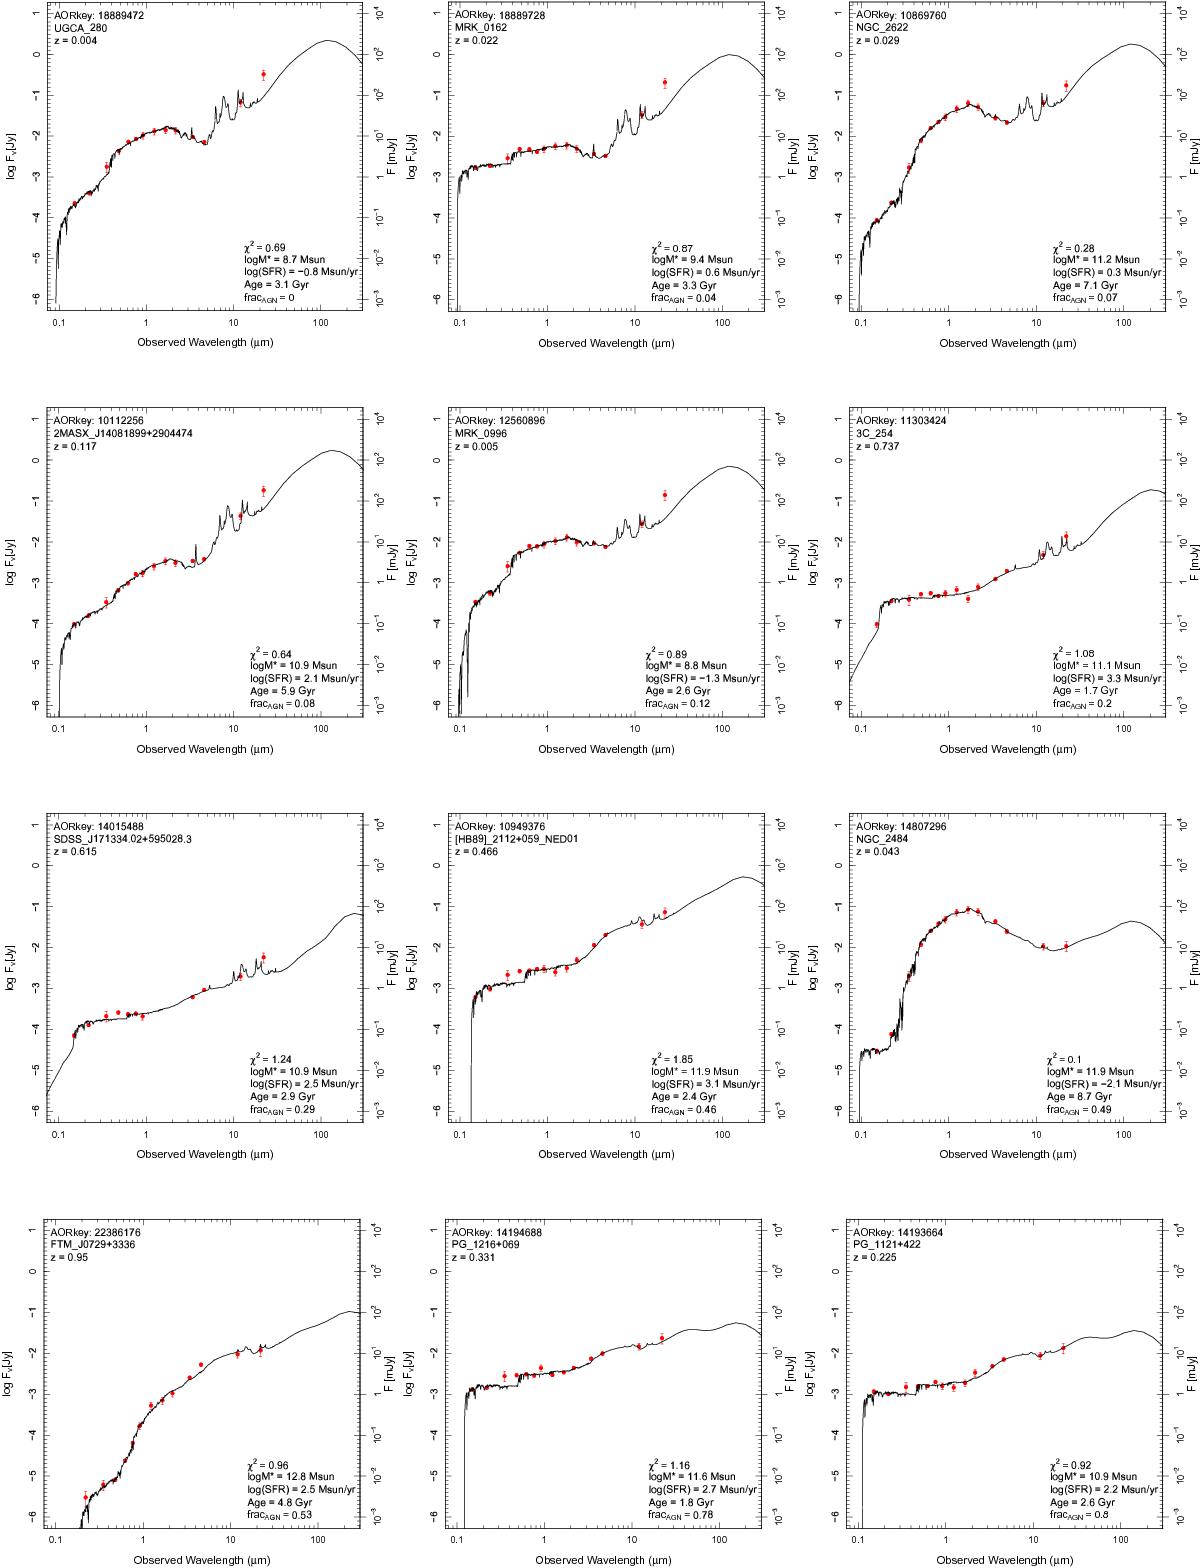
Twelve examples of best-fit models chosen to be representative of our sample, arranged with increasing fracAGN (top to bottom). The observed data are plotted with red points and the best CIGALE model with a solid line. At the top left of each panel we indicate the Spitzer identification number (AORkey), the NED galaxy name and the redshift. The CIGALE output physical parameters, together with the minimised chi square of the fit, are presented at the bottom right.
Current usage metrics show cumulative count of Article Views (full-text article views including HTML views, PDF and ePub downloads, according to the available data) and Abstracts Views on Vision4Press platform.
Data correspond to usage on the plateform after 2015. The current usage metrics is available 48-96 hours after online publication and is updated daily on week days.
Initial download of the metrics may take a while.