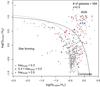
Fig. 10
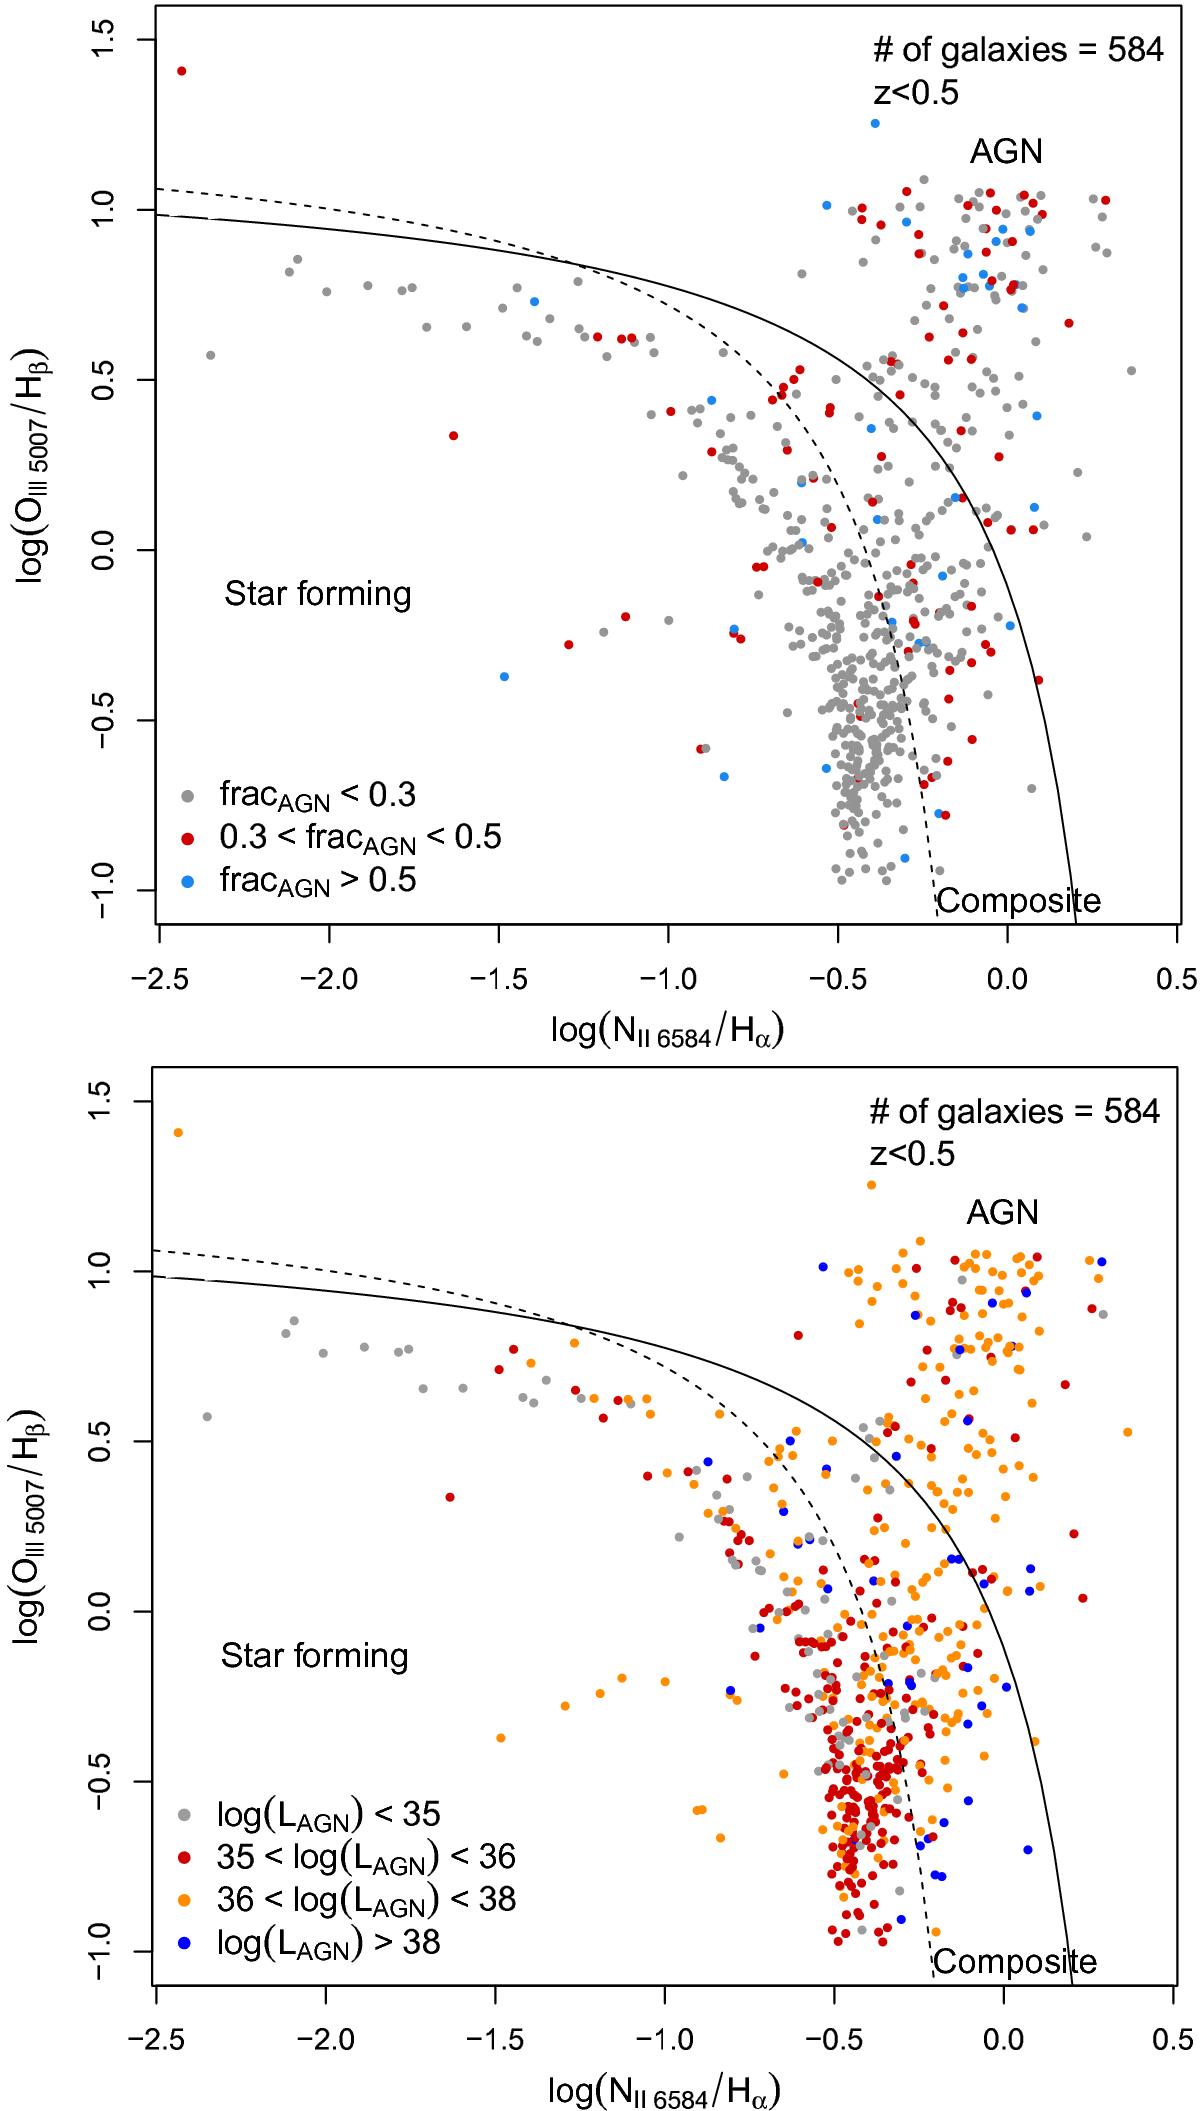
BPT diagnostic diagrams for all galaxies with z< 0.5 that spectral lines measurements from SDSS exist. The solid line is from Kewley et al. (2006), while the dashed line from Kauffmann et al. (2003). The colour coding on the top panel indicates the fracAGN and, in the bottom panel, the AGN luminosity as measured by CIGALE. The median line flux uncertainty is 3% for the [OIII], 2% for the [NII], 3% for the [Hβ], and 1% for the [Hα].
Current usage metrics show cumulative count of Article Views (full-text article views including HTML views, PDF and ePub downloads, according to the available data) and Abstracts Views on Vision4Press platform.
Data correspond to usage on the plateform after 2015. The current usage metrics is available 48-96 hours after online publication and is updated daily on week days.
Initial download of the metrics may take a while.