Fig. 9
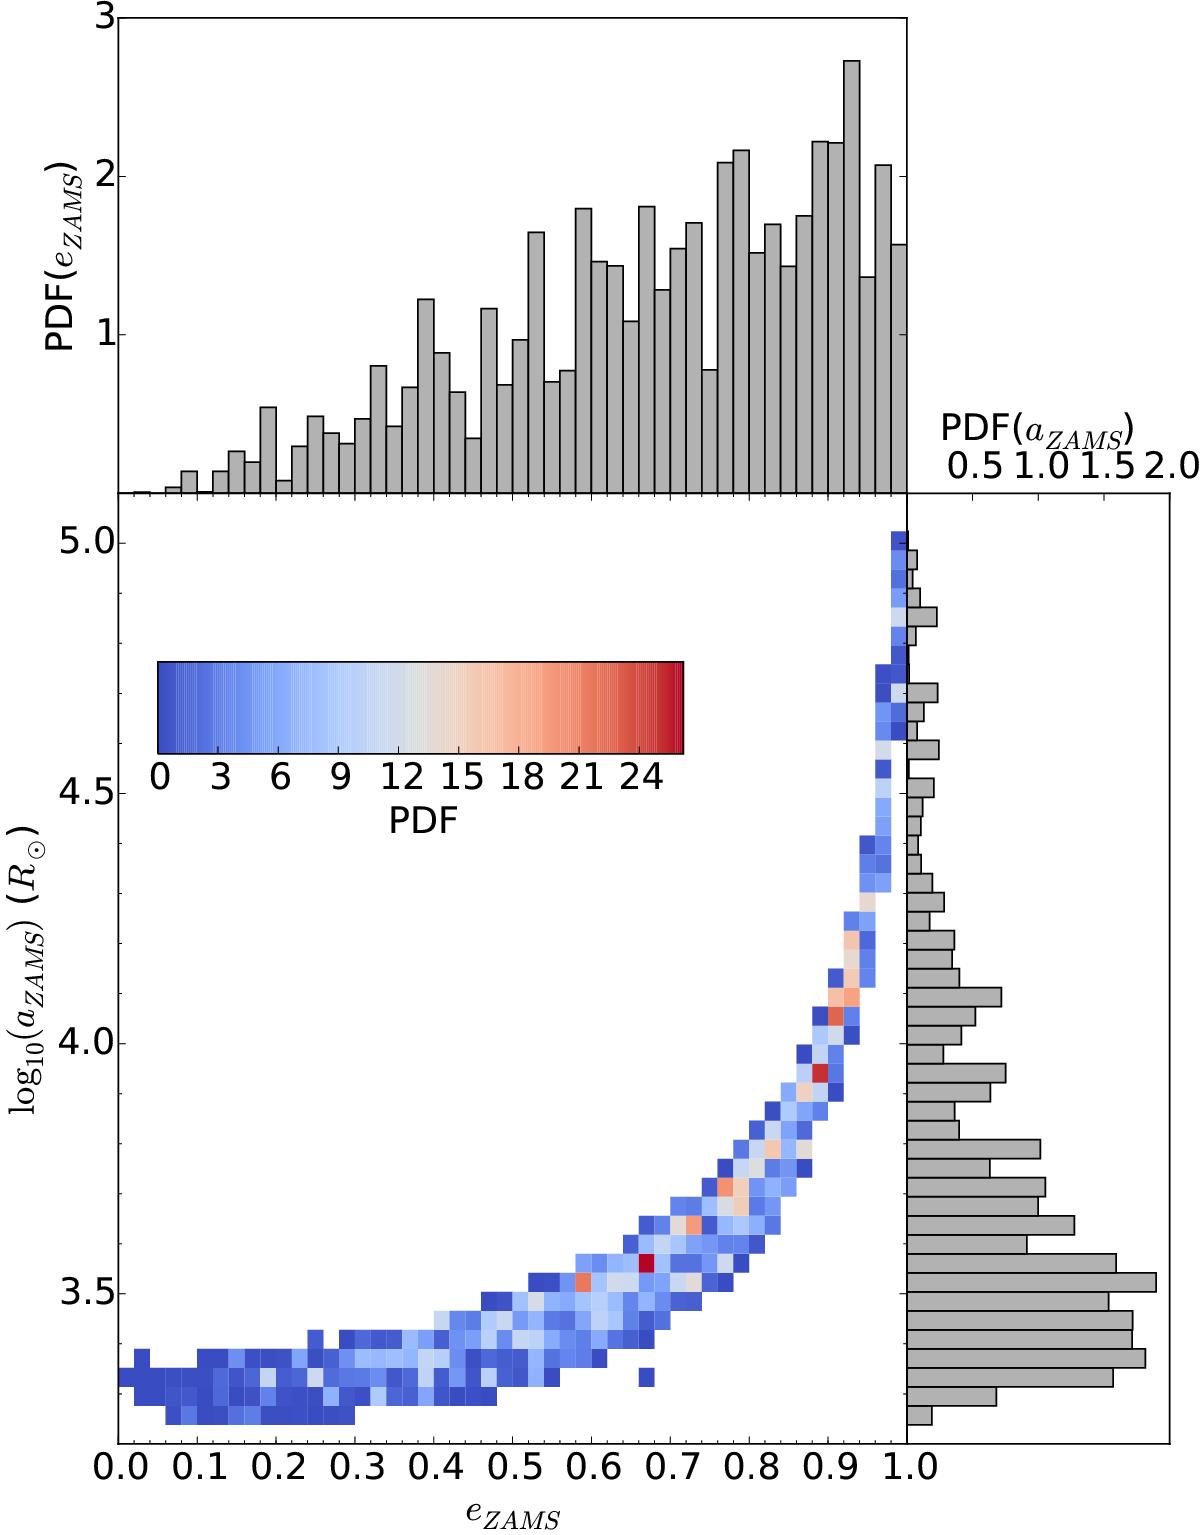
Distribution of log (aZAMS) vs. eZAMS with the total weight applied for all identified LMC X-3 PPS. The top panel shows the weighted histogram of eZAMS and the bottom right histogram shows the distribution of log (aZAMS). The 2D-histogram with the total weight applied has the eccentricity at ZAMS along the x-axis and the orbital separation at ZAMS along the y-axis. The color bar shows the PDF of the 2D-histogram.
Current usage metrics show cumulative count of Article Views (full-text article views including HTML views, PDF and ePub downloads, according to the available data) and Abstracts Views on Vision4Press platform.
Data correspond to usage on the plateform after 2015. The current usage metrics is available 48-96 hours after online publication and is updated daily on week days.
Initial download of the metrics may take a while.