Free Access
Fig. 6
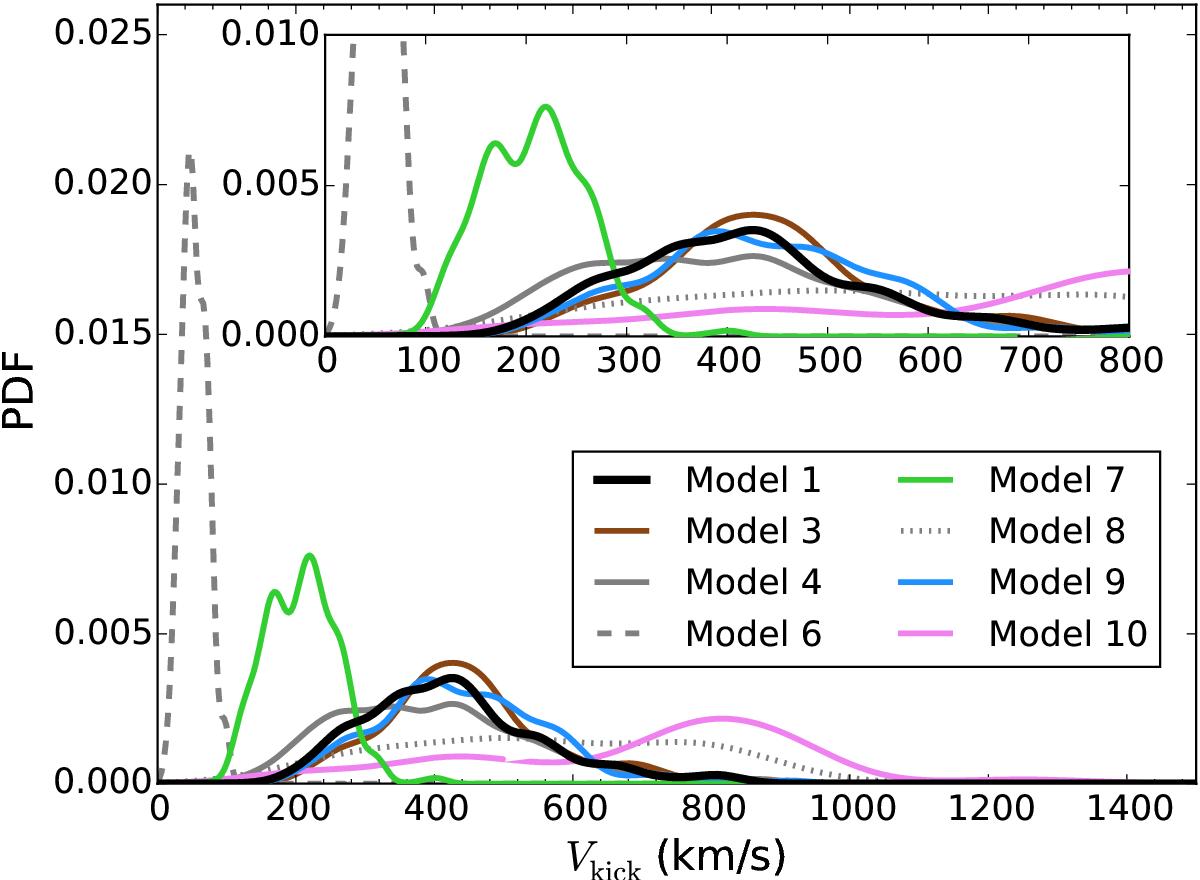
PDF of the kick imparted to LMC X-3 during the SN for the different synthesis population studies. The inset gives a more detailed view of the distribution in the x-axis range from 0 to 800 km s-1 and follows the same axis labels, and the plotted lines have the same legend.
Current usage metrics show cumulative count of Article Views (full-text article views including HTML views, PDF and ePub downloads, according to the available data) and Abstracts Views on Vision4Press platform.
Data correspond to usage on the plateform after 2015. The current usage metrics is available 48-96 hours after online publication and is updated daily on week days.
Initial download of the metrics may take a while.