Fig. 5
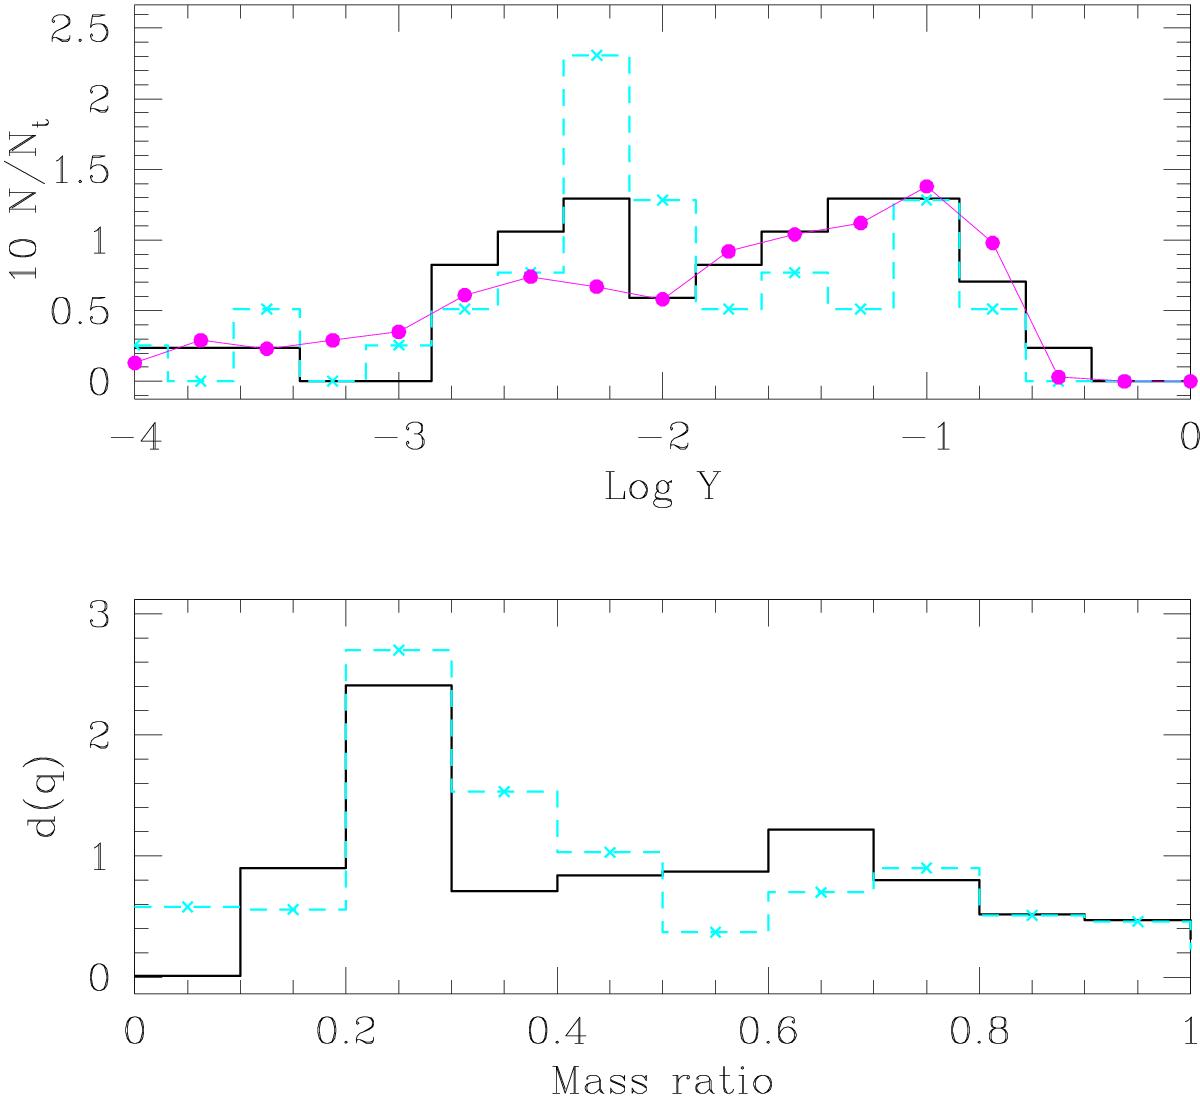
Distribution of log Y (top panel) and mass-ratio distribution (bottom) for the two subsamples of M07, according to their position in the P−e diagram; the heavy black curve corresponds to those systems below the envelope shown in Fig. 4, while the cyan dashed line corresponds to those above the envelope. The latter should therefore not contain post-mass-transfer systems, i.e. systems with a WD companion. In the top panel, the magenta line connected by heavy dots represents the distribution expected in case of a uniform distribution. It can be seen that both subsamples deviate from the uniform distribution and the mass ratio distributions are barely distinguishable, even if the systems with large eccentricities seem to be more peaked around log Y = −2.3.
Current usage metrics show cumulative count of Article Views (full-text article views including HTML views, PDF and ePub downloads, according to the available data) and Abstracts Views on Vision4Press platform.
Data correspond to usage on the plateform after 2015. The current usage metrics is available 48-96 hours after online publication and is updated daily on week days.
Initial download of the metrics may take a while.