Free Access
Fig. 1
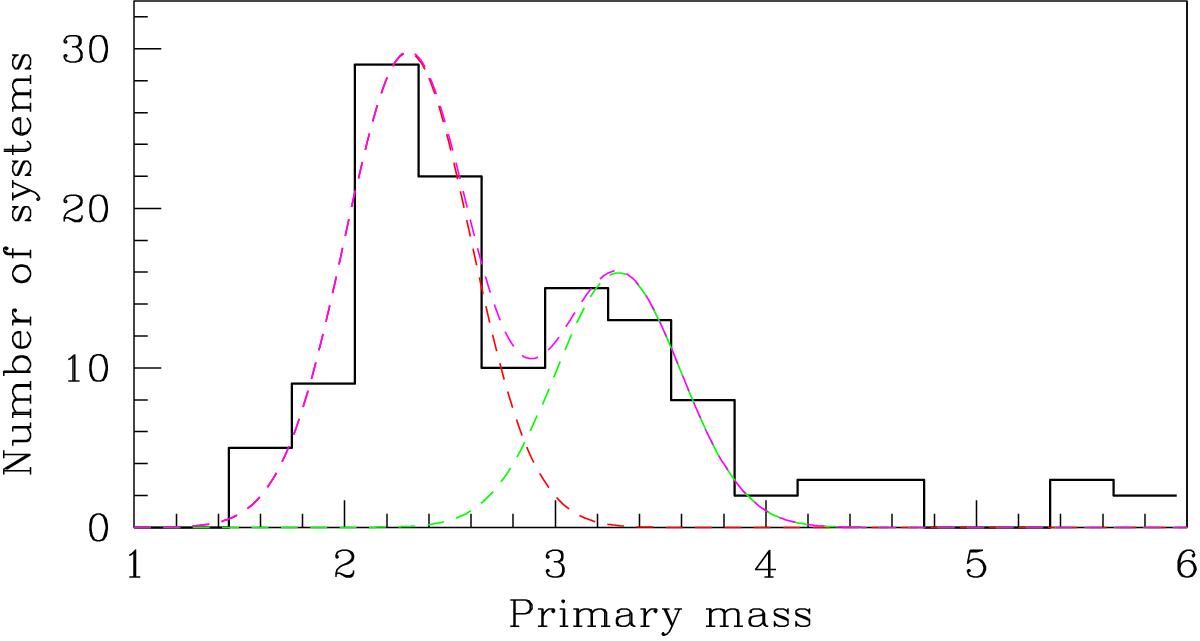
Distribution of the primary masses, M1, for the M07 sample of red giants is shown as the black histogram. We also show a Gaussian distribution centred on 2.3 M⊙ and with σ = 0.3M⊙ with the red dashed line, while the thin dashed green line is a Gaussian centred on 3.3 M⊙ and with σ = 0.3M⊙.
Current usage metrics show cumulative count of Article Views (full-text article views including HTML views, PDF and ePub downloads, according to the available data) and Abstracts Views on Vision4Press platform.
Data correspond to usage on the plateform after 2015. The current usage metrics is available 48-96 hours after online publication and is updated daily on week days.
Initial download of the metrics may take a while.