Fig. 8
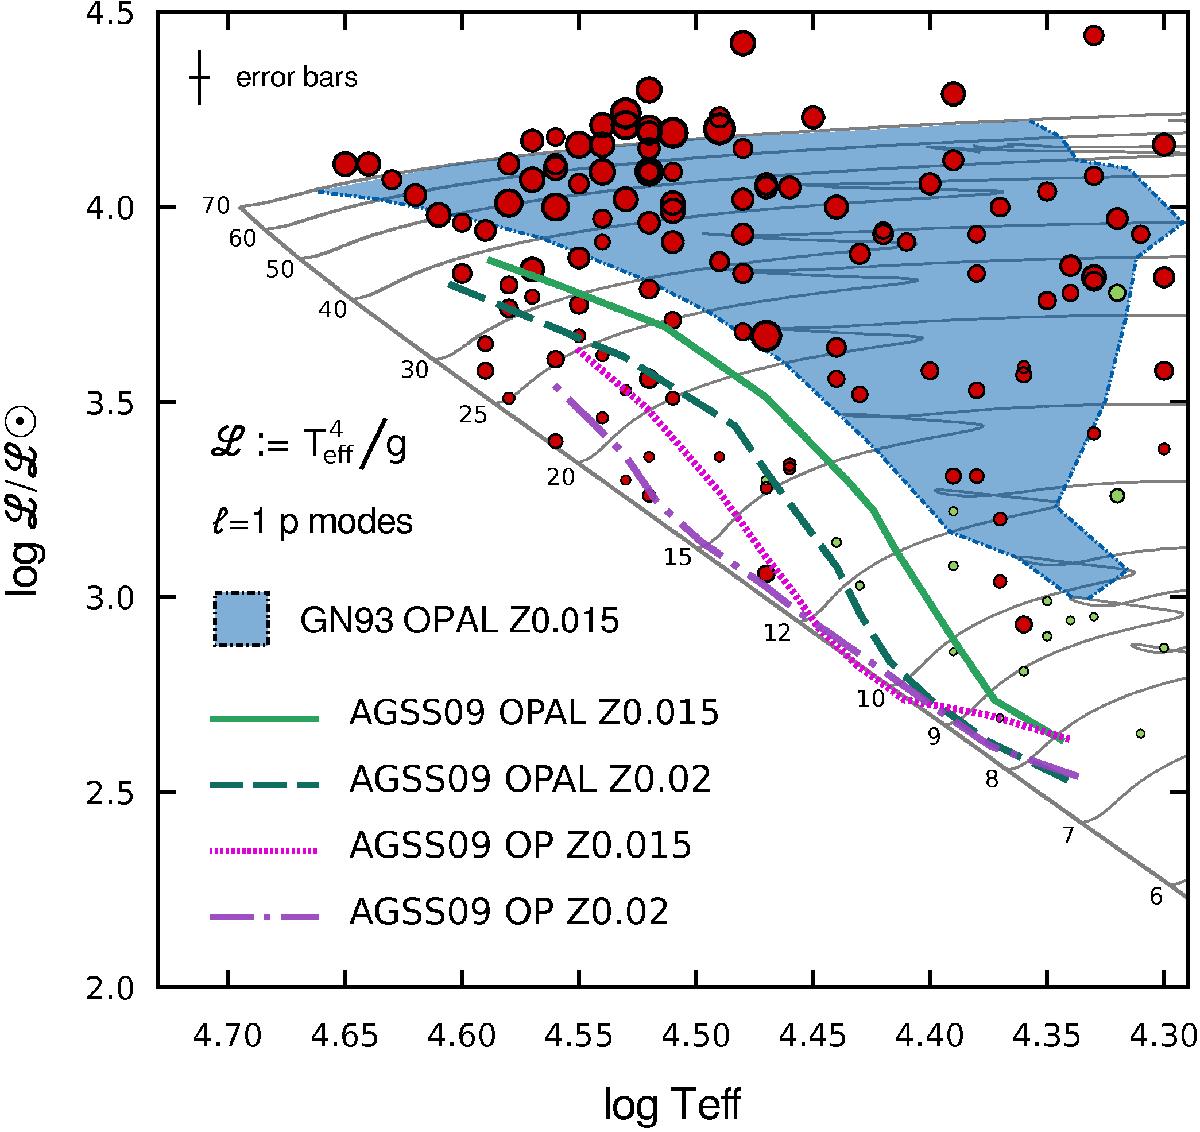
Blue boundary of the instability domains for dipole modes. The blue area limited by a dotted line represents the instability domains already presented (ATON evolutionary code, GN93, Z = 0.015) while green and purple lines stand for the blue boundaries of the instability domains for CLES models computed with the AGSS09 mixture and different metallicities and opacity tables (OPAL and OP, respectively). Green and red points have the same meaning as in Fig. 7 and their sizes are proportional to the macroturbulence velocity.
Current usage metrics show cumulative count of Article Views (full-text article views including HTML views, PDF and ePub downloads, according to the available data) and Abstracts Views on Vision4Press platform.
Data correspond to usage on the plateform after 2015. The current usage metrics is available 48-96 hours after online publication and is updated daily on week days.
Initial download of the metrics may take a while.