Fig. 7
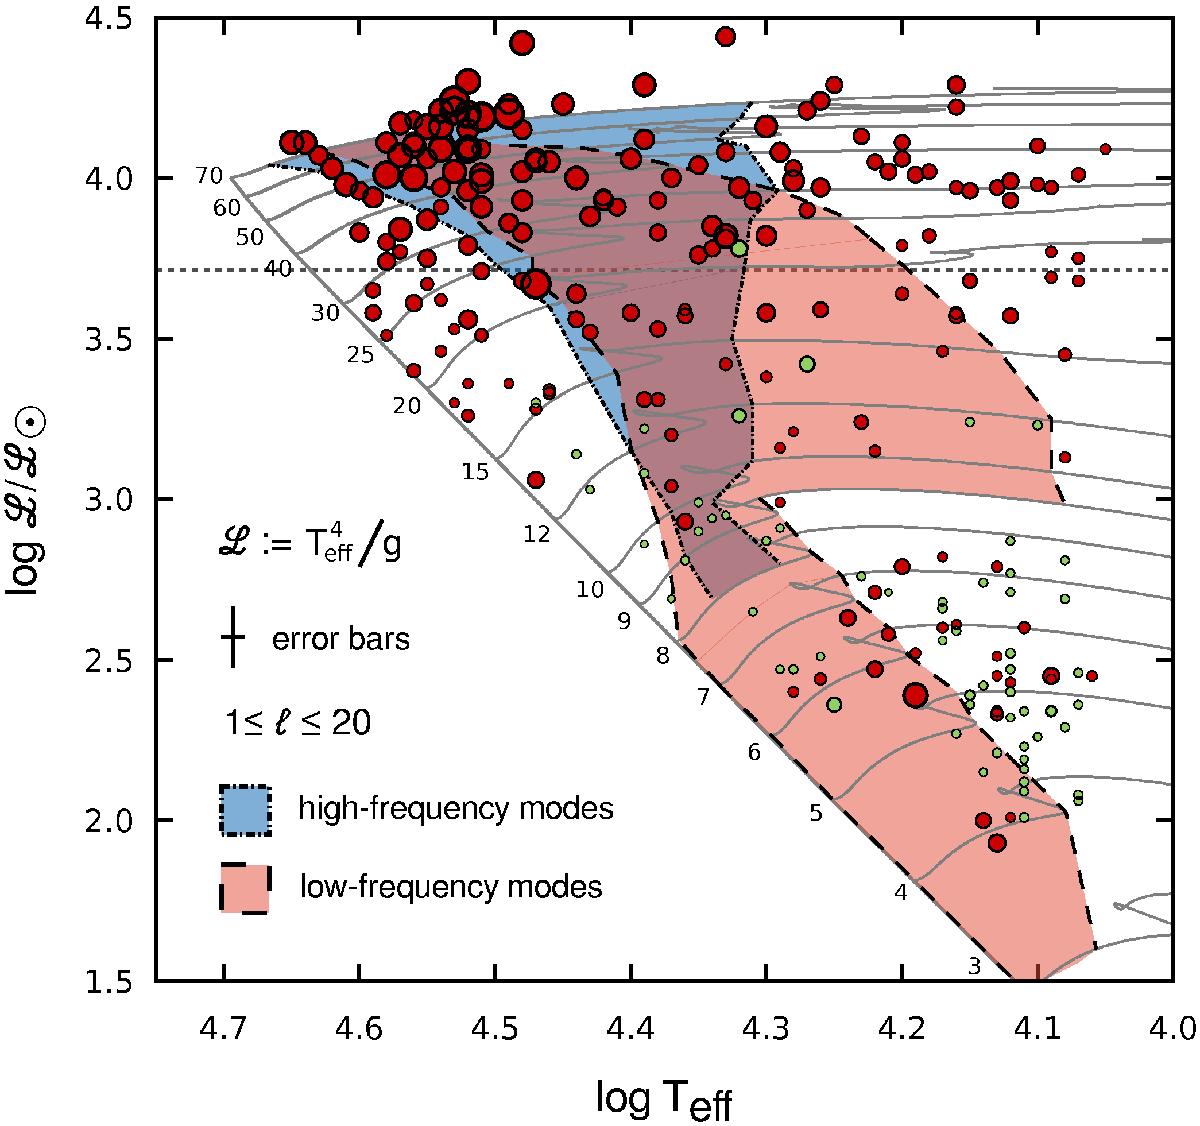
Location in the sHR diagram of the observational dataset presented in Simón-Díaz et al. (2016): red points stand for the stars presenting an important (or dominant) macroturbulent broadening contribution and green points correspond to stars for which either rotational broadening dominates or both vsini and vmac are below 25 km s-1 (see Simón-Díaz et al. 2016, for further details). The size of the points is linearly scaled with vmac, ranging from 10 to 130 km s-1. Instability domain predictions (as described in Sects. 4.1 and 4.2) for 1 ≤ ℓ ≤ 20 are colored in blue and red.
Current usage metrics show cumulative count of Article Views (full-text article views including HTML views, PDF and ePub downloads, according to the available data) and Abstracts Views on Vision4Press platform.
Data correspond to usage on the plateform after 2015. The current usage metrics is available 48-96 hours after online publication and is updated daily on week days.
Initial download of the metrics may take a while.