Fig. 4
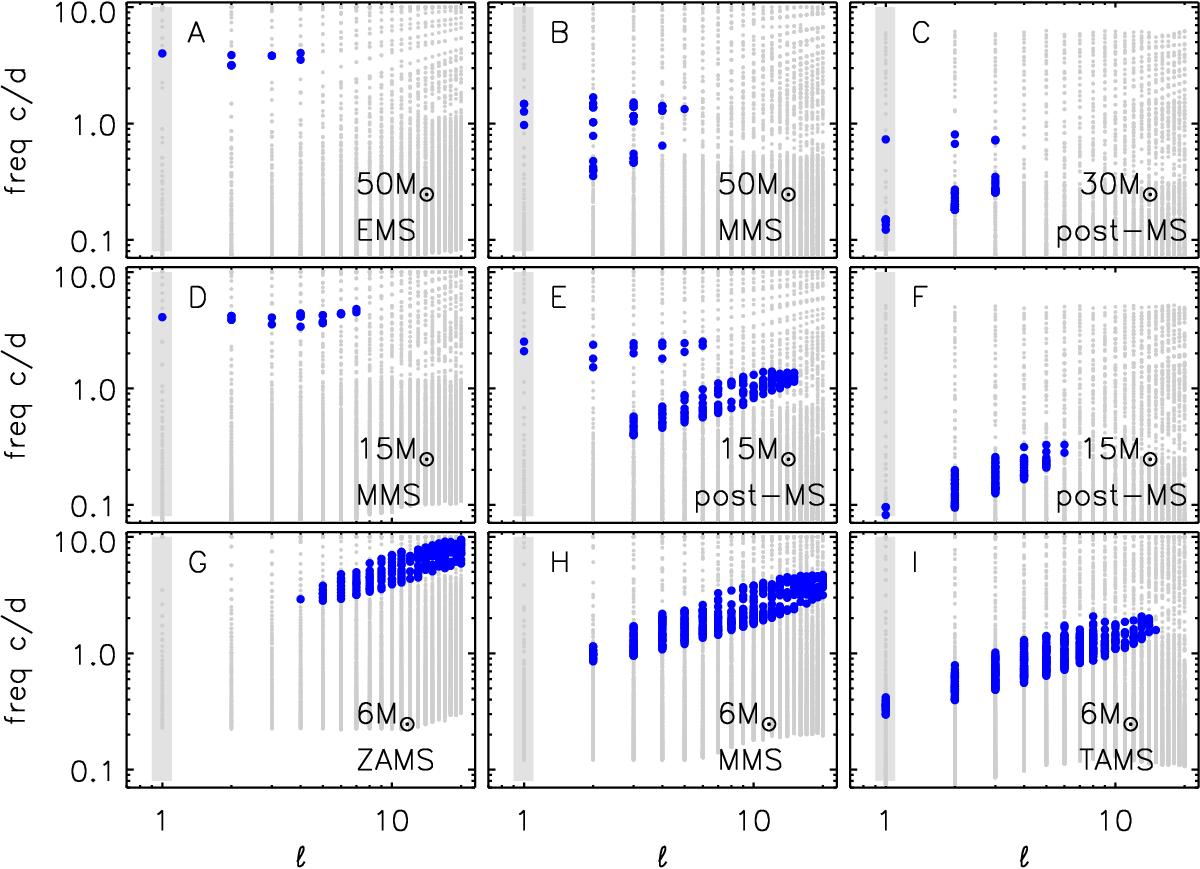
Range of frequencies in cycle per day (c/d) for models A to I. Gray dots stand for the frequencies of the stable modes computed, whereas excited mode frequencies are represented by blue bigger dots. From left to right, the rows represent the evolution from the MS to the post-MS: models A to C for high masses (30–50 M⊙), models D to F for 15 M⊙, and models G to I for 6 M⊙ MS models only (see Fig. 2 and Table 1). Rough evolutionary states are indicated for each model in the right bottom corner (ZAMS, EMS, MMS, TAMS, and post-MS stand for zero age MS, early MS, middle of MS, terminal age MS, and hydrogen-burning shell models). We note that the detectability of the pulsation modes in photometry is limited to the low degree (ℓ up to 3–4), whereas higher degree modes should be able to be observed thanks to spectroscopy.
Current usage metrics show cumulative count of Article Views (full-text article views including HTML views, PDF and ePub downloads, according to the available data) and Abstracts Views on Vision4Press platform.
Data correspond to usage on the plateform after 2015. The current usage metrics is available 48-96 hours after online publication and is updated daily on week days.
Initial download of the metrics may take a while.