Fig. 2
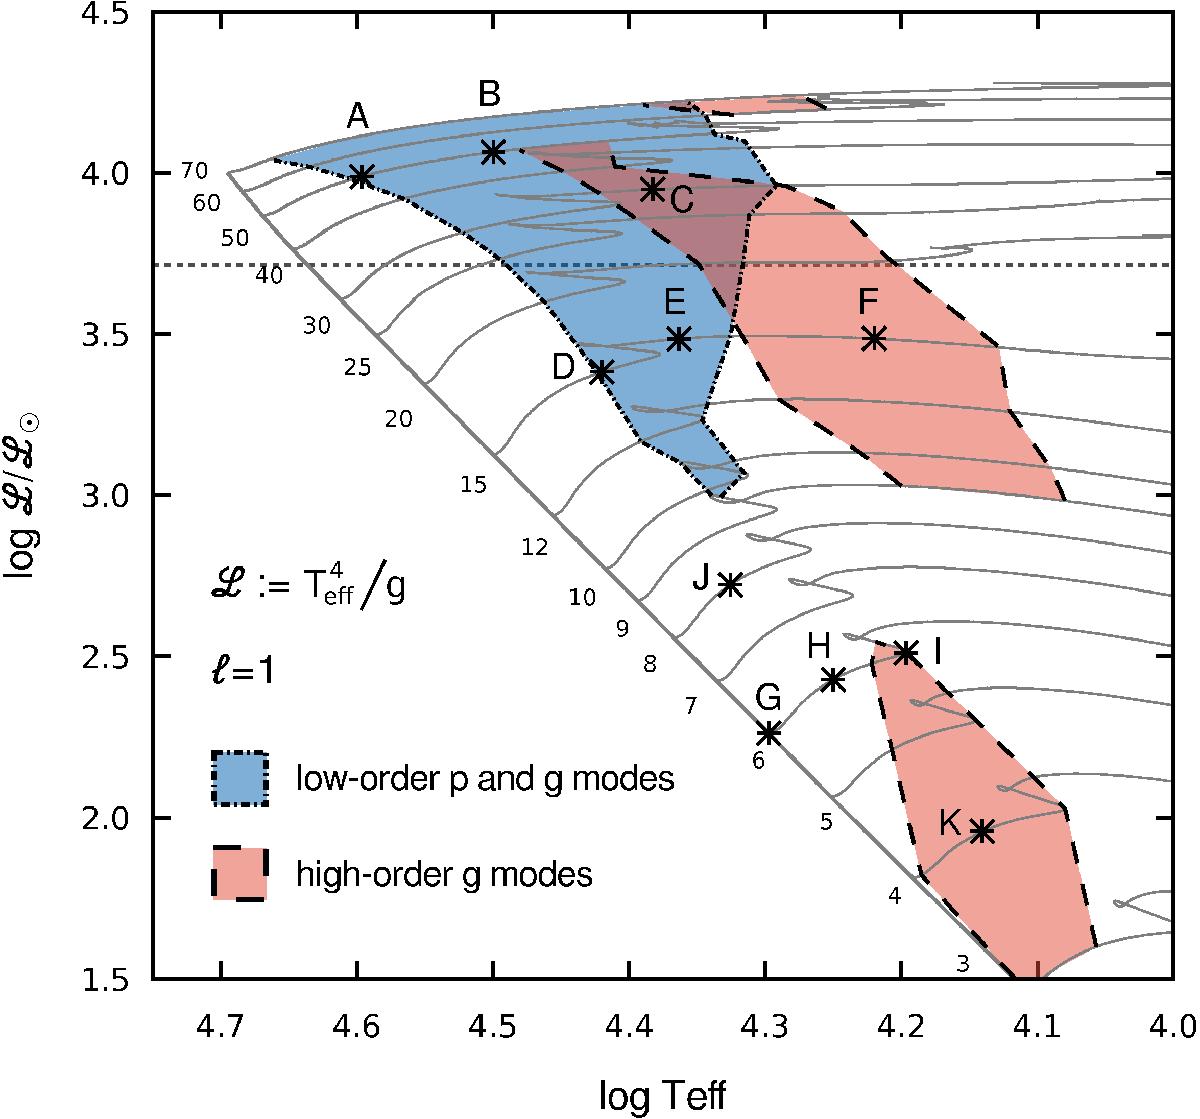
Instability domain predictions in the sHR diagram for dipole modes (ℓ = 1, see Sect. 4.1). P-mode instabilities are represented by the blue area and the g-mode domain is shown in red. The ATON non-rotating evolutionary tracks are over plotted. The horizontal dashed line indicates the limit above which strange mode oscillations are most likely expected. Black asterisks stand for nine selected models la A to I which will be more deeply investigated in Sect. 4.2. The global properties of these models are given in Table 1.
Current usage metrics show cumulative count of Article Views (full-text article views including HTML views, PDF and ePub downloads, according to the available data) and Abstracts Views on Vision4Press platform.
Data correspond to usage on the plateform after 2015. The current usage metrics is available 48-96 hours after online publication and is updated daily on week days.
Initial download of the metrics may take a while.