Fig. 1
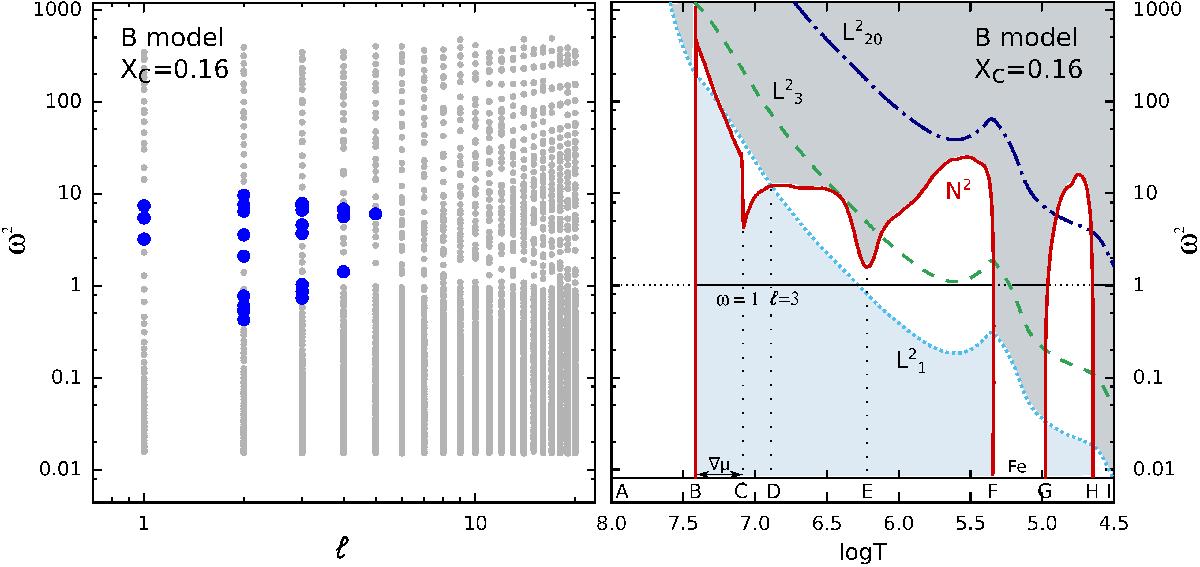
Left: modal diagram: range of dimensionless frequencies for a 50 M⊙ MS model (labeled B in Table 1) as a function of the degree ℓ of the mode. Stable modes are represented by gray points while excited modes are shown with solid blue circles. Right: propagation diagram for the same model. The solid red line stands for the Brunt-Väisälä frequency, and the Lamb frequency for three different degrees (ℓ = 1, 3 and 20) is represented by the dotted, dashed, and dot-dashed lines, respectively. The propagation zones for p and g modes with ℓ = 1 are highlighted by the dark gray and light blue shadow regions, respectively. The solid horizontal black line stands for an example of the propagation zones for a mode of ω = 1.0 with ℓ = 3.
Current usage metrics show cumulative count of Article Views (full-text article views including HTML views, PDF and ePub downloads, according to the available data) and Abstracts Views on Vision4Press platform.
Data correspond to usage on the plateform after 2015. The current usage metrics is available 48-96 hours after online publication and is updated daily on week days.
Initial download of the metrics may take a while.